

The slide of the lecture is on the left, the same figure on the right, computed in the browser from the same data. The ▶ button moves the parameter step by step.
What a Blockchain Records · The Market in Numbers · On-Chain Activity · Growth on a Log Scale
What a Blockchain Records
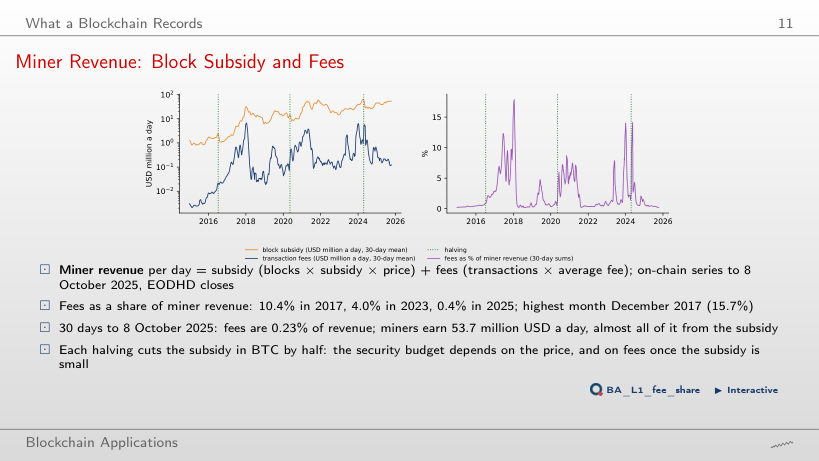
Miner Revenue: Block Subsidy and Fees
Answer
3.61%. Four halvings divide the subsidy by 2⁴ = 16, from 53.5 to 3.3 USD million a day, while fees stay at 0.13 USD million a day; the fee share roughly doubles with each halving (0.47%, 0.93%, 1.84%, 3.61%) as long as fees are small. Even then fees do not carry the network: revenue falls from 53.7 to 3.4 USD million a day. In the 30 days to 17 January 2018, the highest fee share of the sample (17.9%), the same four halvings would give 78%.
The Market in Numbers
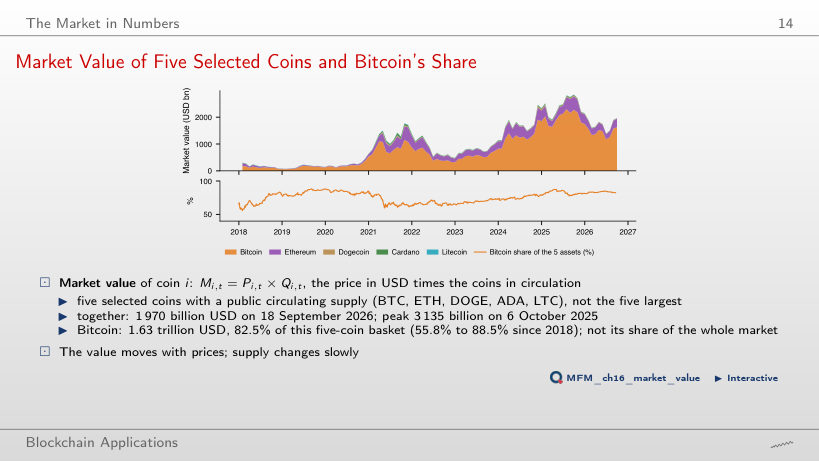
Market Value of Five Selected Coins and Bitcoin's Share
Answer
1.42. The shares are 82.5% (Bitcoin), 16.2% (Ethereum), 0.7% (Dogecoin), 0.4% (Cardano) and 0.2% (Litecoin); the HHI, the sum of the squared shares, is 0.71, and 1/0.71 = 1.42. The basket has five coins, but its value behaves like that of 1.42 coins of equal size. 1/0.825 = 1.21 would count Bitcoin alone; the Ethereum share adds 0.162² = 0.026 to the HHI.
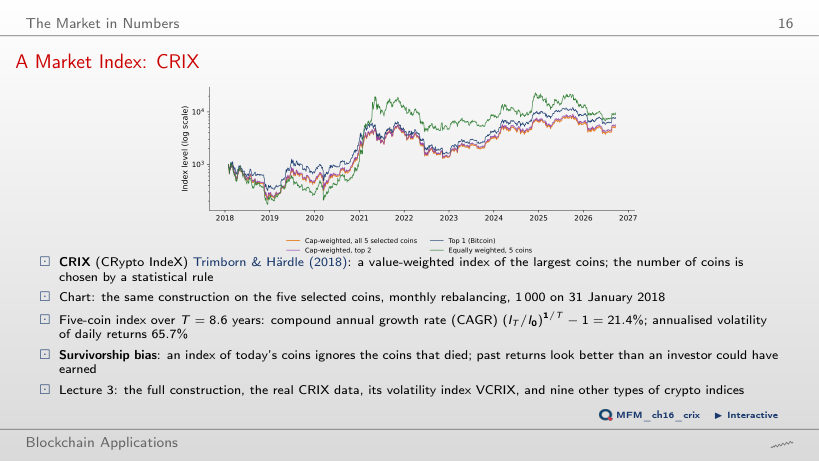
A Market Index: CRIX
Answer
It falls from 11.13% a year (Bitcoin alone) to 2.71% (top 2), 1.69% (top 3) and 0.90% (top 4). Bitcoin dominates the basket, but its share moved between 55.8% and 88.5% since 2018, so the Bitcoin-only index still departs from the five-coin index. The Akaike information criterion chooses k = 4. The tracking error measures the difference of the daily returns, not the volatility of the index: the five-coin index itself has a volatility of 65.7% a year.
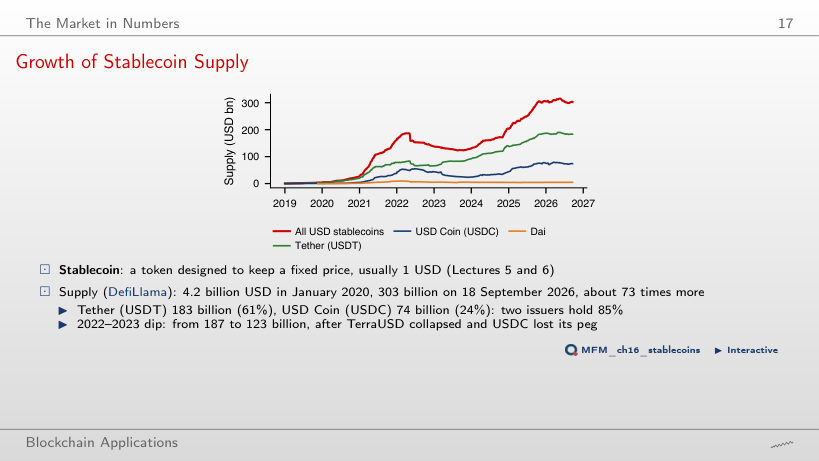
Growth of Stablecoin Supply
Answer
It stayed about the same: 82.1 USD bn on 2 April 2022 and 82.8 USD bn on 19 August 2023. The fall came from the other issuers: USD Coin went from 52.2 to 25.4 USD bn and Dai from 9.2 to 3.9 USD bn. The issuers do not move in proportion, and the largest issuer did not account for the largest decline.
Stablecoin Issuers
Answer
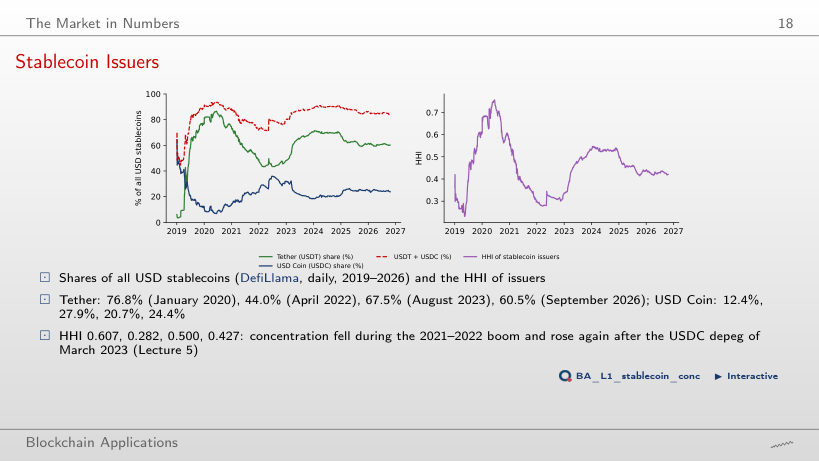
It rose, from 0.282 to 0.500. Shares enter the index squared, so the largest share dominates it: 0.675² = 0.456 alone is above the April 2022 value. The two largest shares are enough to see the direction: in April 2022 the HHI could be at most 0.440² + 0.279² + 0.281² = 0.350, with all the remaining 28.1% held by a single issuer, and in August 2023 it is at least 0.456.
DeFi: Total Value Locked
Answer
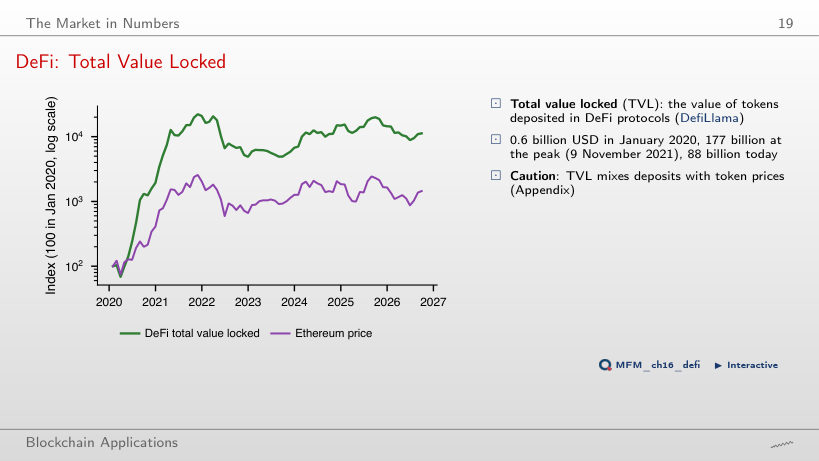
Not that half of the deposits left. TVL is the quantity of tokens times their price. With November 2021 as the base month, the Ether price falls to 0.56 of its level (4,632 to 2,611 USD) and TVL to 0.51 (174 to 88 USD bn). Most of the fall can come from lower prices; the chart alone cannot separate quantities from prices (the appendix of the lecture does this for a fixed-price TVL). Deposits did not rise either: TVL fell slightly more than the Ether price.
January 2024: Spot Bitcoin Exchange-Traded Funds
Answer
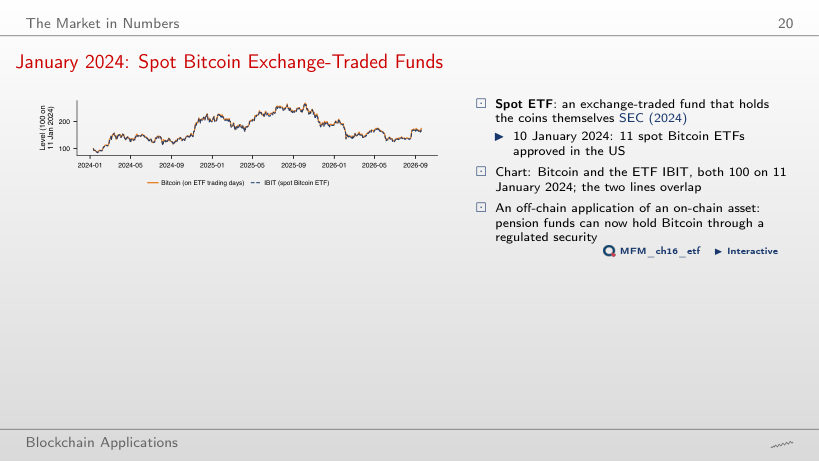
Slightly below: IBIT is at 172.8 and Bitcoin at 174.5, about 1% lower after 674 common trading days. The drift of ln(IBIT/Bitcoin), the slope of a linear trend in years, is −0.24% a year: the cost of holding Bitcoin through the fund. The fund holds the coins, so the two lines overlap, but not exactly; skipping weekends does not lift the ETF above Bitcoin, because both are compared on the same trading days.
On-Chain Activity
Four Views of a Blockchain
Answer
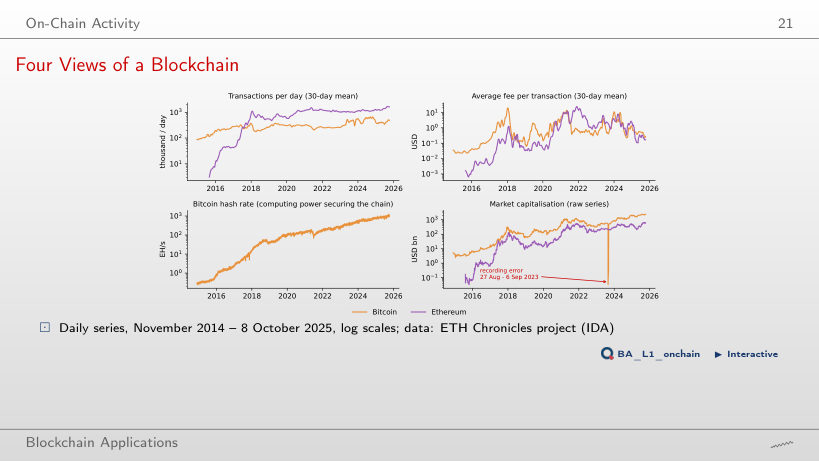
It falls: from 92.37 USD with daily values to 28.75 USD (7 days), 19.81 USD (30 days) and 11.32 USD (90 days). A longer mean averages the peak days with calmer days, so the reported peak depends on the smoothing; the Ethereum peak falls from 37.88 to 19.39 USD. A quoted peak is only comparable with another peak smoothed in the same way.
Market Value and Network Activity
Answer
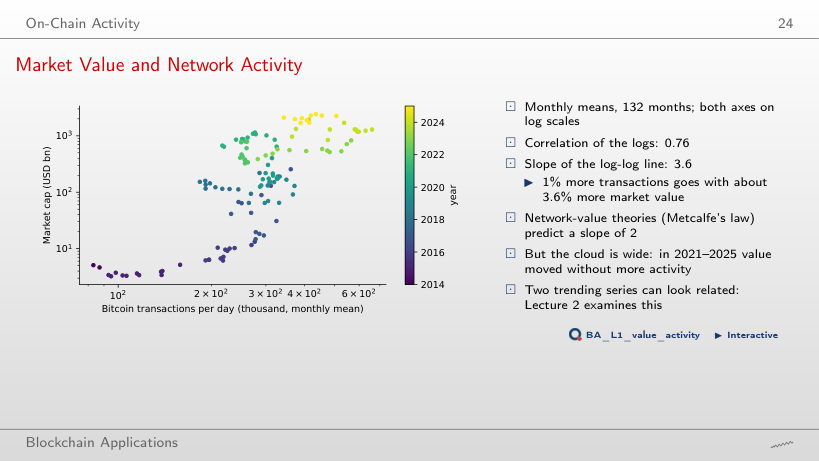
No. With the sample ending in October 2016 the slope is 0.95; it is 2.35 to October 2018, 3.28 to October 2021 and 3.59 to October 2025. The slope describes the association of two trending series over a given period; it is not a stable elasticity, and it is near the slope of 2 of Metcalfe's law only for samples ending in late 2017 or in 2018. Lecture 2 tests the relation formally.
Growth on a Log Scale
Trend Lines on a Log Scale
Answer
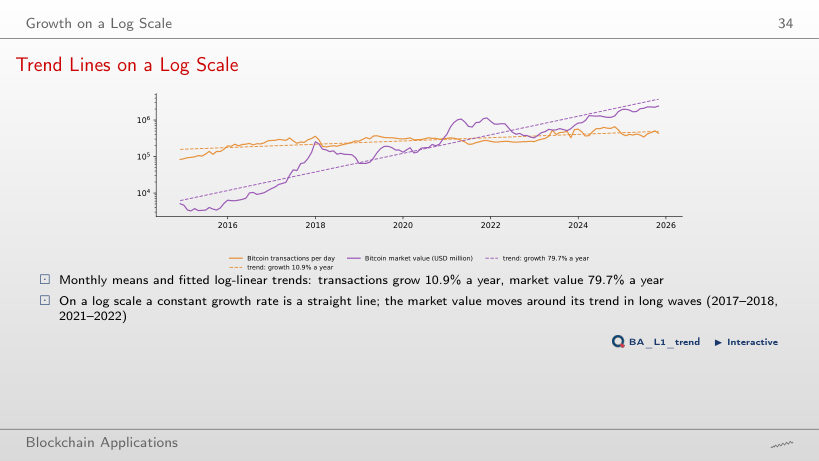
It falls from 79.7% to 29.6% a year (ĝ = 0.260 instead of 0.586). The regression uses every month of the sample, but the sample still decides the result: the years of fastest growth, 2015–2017, drop out. Higher market values in the later years do not mean faster growth: the slope measures the change of the log level, not the level. Transactions grow 17.1% a year from November 2020, against 10.9% from November 2014.
Out-of-Sample Check of the Trend after One Year
Answer
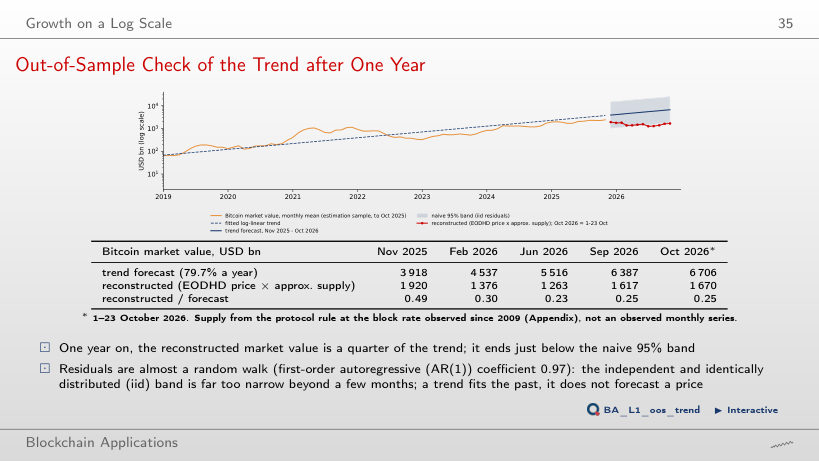
For 16 of the 33 origins (48%), every time below the band; a valid 95% band would miss about 5% of the time. The band is wide, from 0.26 to 3.8 times the forecast at the October 2025 origin, but it assumes independent residuals; the residuals have an AR(1) coefficient of 0.97, so deviations from the trend last for years and the band is far too narrow beyond a few months. At the October 2025 origin, the October 2026 value, 1,670 USD bn, lies just below the band, which starts at 1,770 USD bn.
Prices: EODHD daily closes. Coins in circulation: Coin Metrics Community Data. Stablecoin supply and DeFi total value locked: DefiLlama snapshots. On-chain series: ETH Chronicles project (IDA), November 2014 to 8 October 2025. Lecture samples end on 18 September 2026; the out-of-sample check uses prices to 23 October 2026.