

The slide of the lecture is on the left, the same figure on the right, computed in the browser from the same data. The ▶ button moves the parameter step by step.
The Shape of Returns · Volatility and Correlation · Market Efficiency · Bubbles, Crashes and Network Value
The Shape of Returns
Fit of the Normal Distribution
Answer
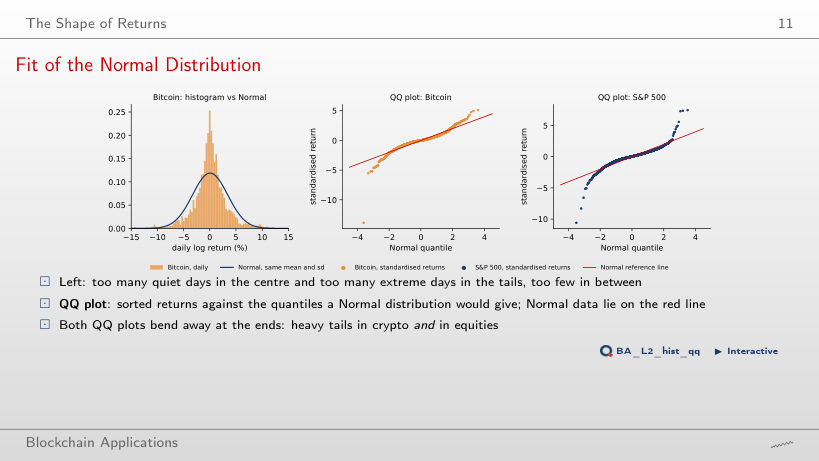
The S&P 500: 9 days against 5 for Bitcoin, where the Normal distribution expects about 0.001 and 0.002 days. The threshold is measured in each asset's own standard deviation (1.21% a day for the S&P 500, 3.35% for Bitcoin), so the count compares the shape of the tails, not the size of the moves: the excess kurtosis is 14.9 for the S&P 500 and 14.8 for Bitcoin. In percent Bitcoin moves more: it exceeds 5% on 10.7% of the days, the S&P 500 on 0.6%.
Volatility and Correlation
Volatility Through Time
Answer
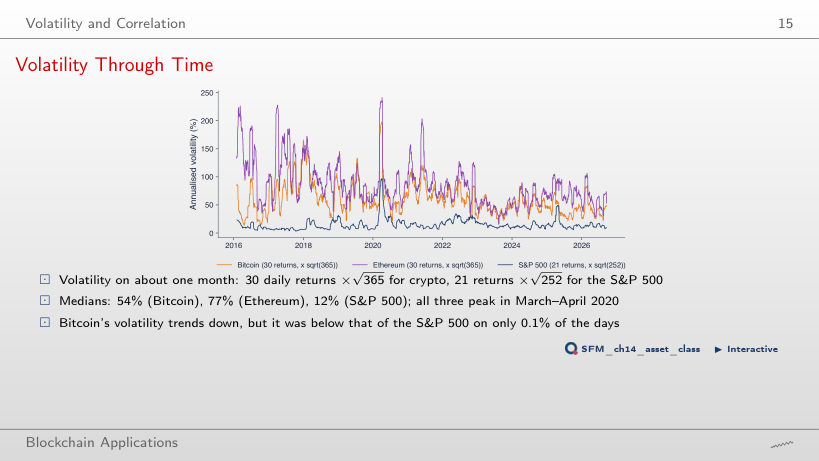
It rises: 47% with 7 days, 54% with 30 days, 58% with 90 days and 66% with 365 days, close to the 64.1% of the whole sample. A short window rarely contains one of the few very large days, so most short-window estimates lie below the long-run volatility and a few lie far above it: the maximum falls from 364% (7 days) to 106% (365 days). The S&P 500 median moves the same way, from 11% to 15%.
Volatility Clusters
Answer
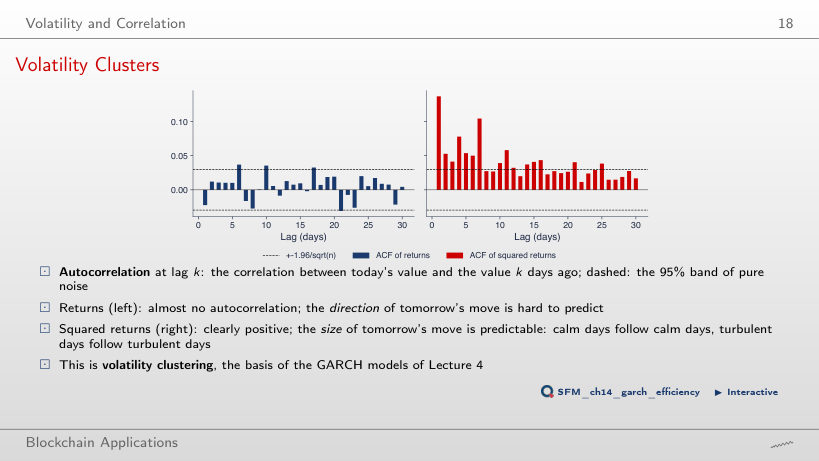
Only for m = 10 and 11 and for m = 21 to 29. Q(m) grows with m, but so does the 5% critical value of χ²(m): at m = 12, Q = 20.6 against 21.0; at m = 30, Q = 43.5 against 43.8 (p-value 0.052). For returns the verdict depends on the number of lags, so the evidence of a predictable direction is weak. For squared returns Q(m) runs from 82 (m = 1) to 296 (m = 30), and every m rejects.
Absolute Returns after Calm and Turbulent Days
Answer
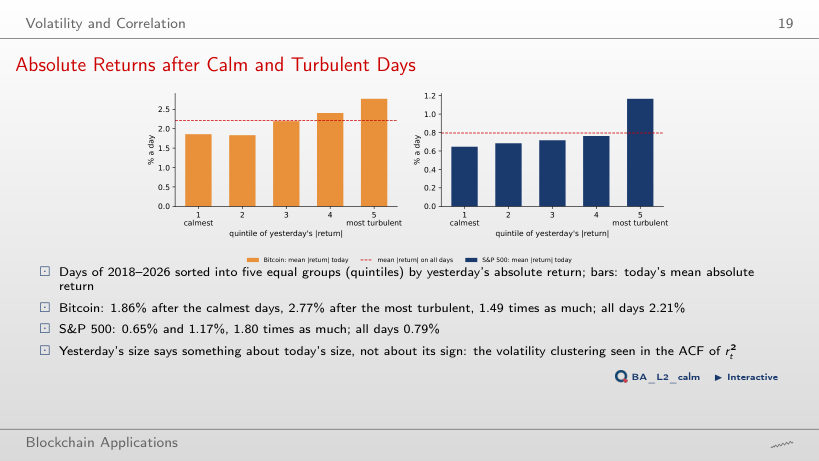
Still higher: 2.39% against 2.07% a day, 1.15 times, against 1.49 times at L = 1; at L = 60 the ratio is 1.03. For the S&P 500 it is still 1.39 at L = 30 (1.02% against 0.73%) and 0.91 at L = 60. A turbulent day raises the expected size of moves for weeks: volatility has a long memory, which the GARCH models of Lecture 4 describe with a slowly decaying variance. Turbulence is not followed by unusual calm: the bars do not turn upside down.
Correlation of Bitcoin with Equities
Answer
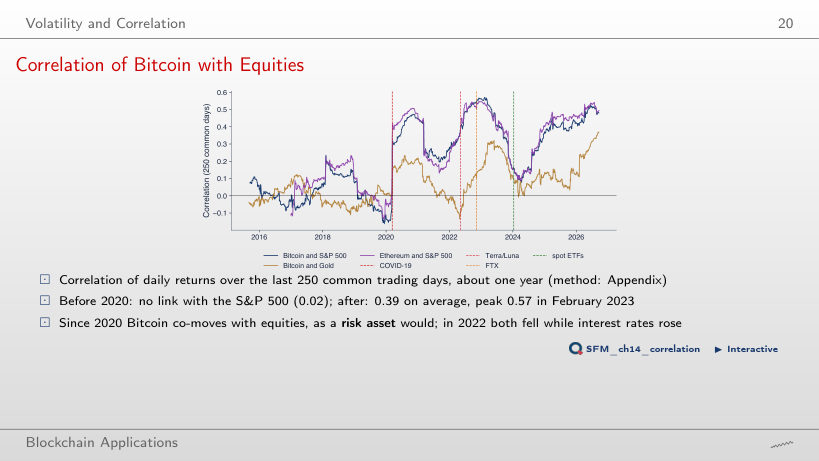
0.79 (May 2022), and the lowest falls from −0.16 to −0.64. A correlation estimated on 30 days has a large sampling error (about 1/√30 = 0.18 when the true correlation is zero), so short windows give more extreme highs and lows; the 500-day window gives 0.47 and −0.07. The correlation from 2020 onwards, 0.39, does not depend on the window.
Market Efficiency
Variance Ratios by Sub-Period
Answer
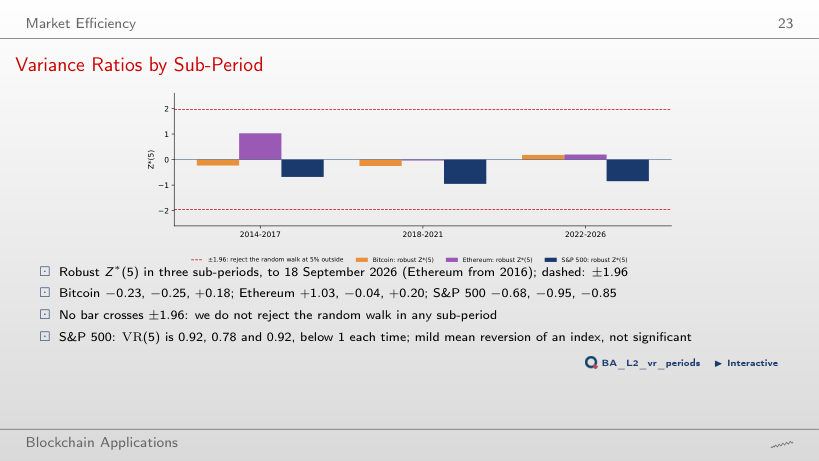
10 times, 3.8% of the tests: the S&P 500 in 2018–2021 at q = 2 (Z* = −2.31), and Ethereum in 2016–2017 for q = 22 to 30 (Z* up to 2.48 at q = 30). Bitcoin never crosses. Under a random walk about 5% of 261 tests, 13, would reject by chance, and tests at neighbouring horizons are strongly dependent, so the nine rejections of Ethereum at q = 22–30 are one finding, not nine. Not rejecting at q = 5 does not settle every horizon, but these rejections are no evidence of weekly trends either.
Efficiency Through Time
Answer
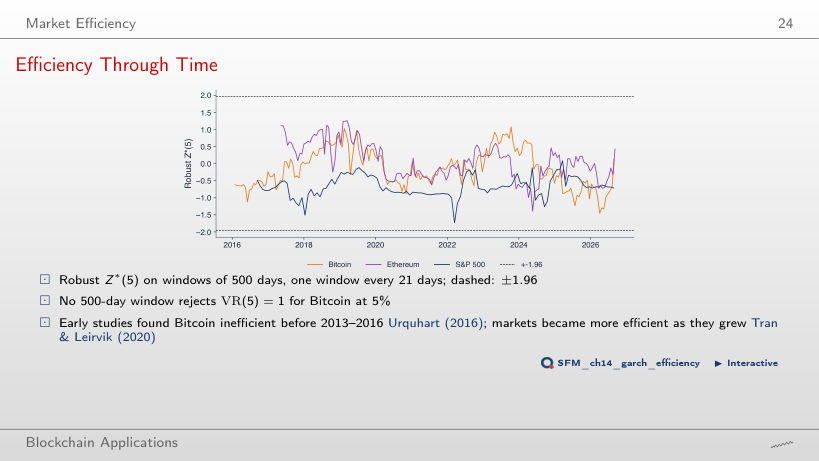
The S&P 500: 24 of 120 windows (20%) reject VR(2) = 1, all with Z* below −1.96 (lowest −2.73); Ethereum 2 of 163, Bitcoin none of 185. VR(2) − 1 is close to the lag-1 autocorrelation, and the daily S&P 500 index has a negative one (VR(2) = 0.875 over 2014–2026). Volatility does not make returns predictable: Bitcoin, the most volatile asset, has no rejecting window.
Bubbles, Crashes and Network Value
Drawdowns of Bitcoin, Ethereum and the S&P 500
Answer
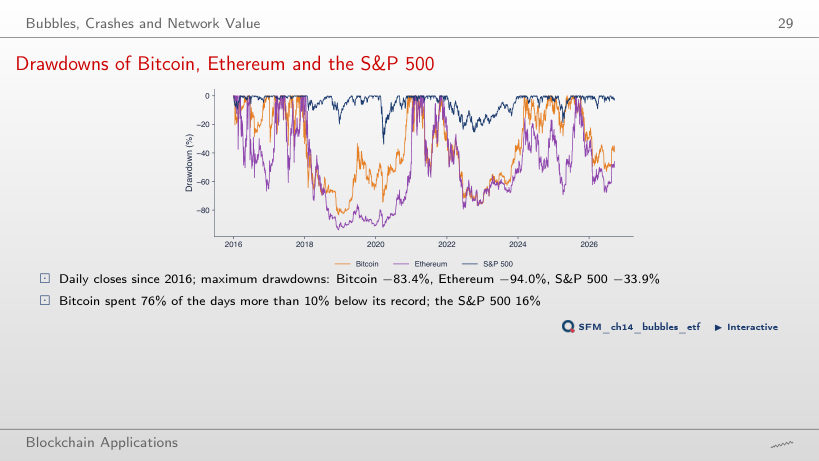
34%, about one day in three; Ethereum 52%, the S&P 500 none (its maximum drawdown is −33.9%). The share falls much more slowly than the threshold rises, because Bitcoin's deep drawdowns lasted for long periods (2018–2020 and 2022–2023). Recovering from −50% needs a gain of 100%.
Bitcoin 2017: an LPPL Fit
Answer
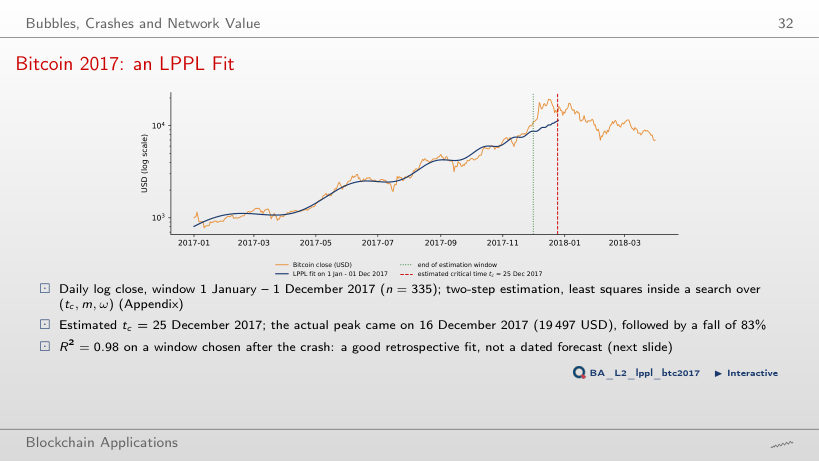
Very little: it stays between 0.962 (tc = 31 March 2018) and 0.982 (25 December 2017); it is 0.975 for tc = 2 December and 0.981 for 1 January. A fit this good for every tc over four months cannot date the crash: the window determines the shape of the past rise, not the critical time. The actual peak, 16 December 2017, has no special place in this R² profile.
t̂c across Estimation Windows
Answer
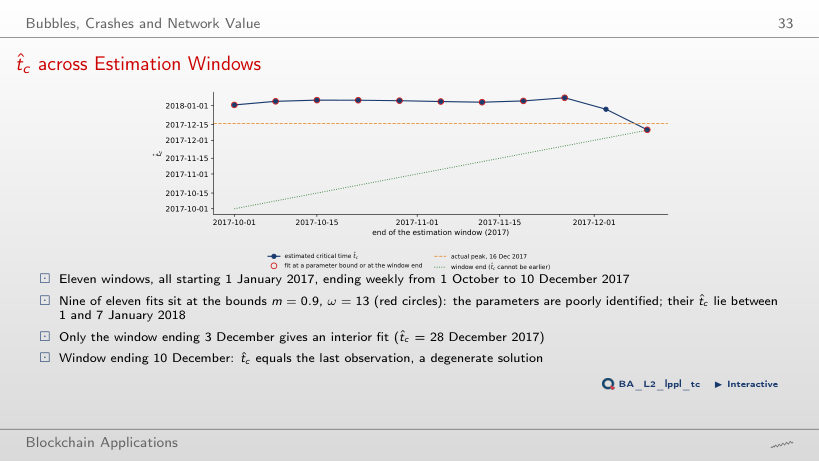
No. For the first nine windows the estimated tc stays between 1 and 7 January 2018, with m = 0.9 and ω = 13 at the bounds of the search; the window ending 3 December gives the only interior fit (tc = 28 December), and the window ending 10 December puts tc at the window end itself. More data near the peak did not narrow down the date: the estimates are driven by the bounds of the search.
Market Value against Metcalfe Value
Answer
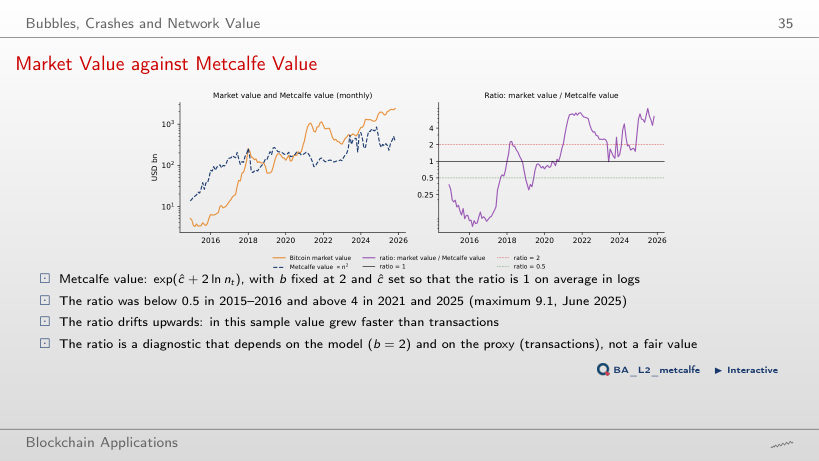
Near b = 3.6: the standard deviation of the log ratio is 1.45 at b = 2 and 1.29 for b between 3.25 and 3.75. With the constant set so that the ratio is 1 on average in logs, minimising this spread is least squares, so the minimum is at the least-squares slope b = 3.59 of the lecture. The choice of b also changes the reading: the last ratio, October 2025, is 6.5 with b = 2 and 3.2 with b = 3.6. The ratio is a diagnostic of the model, not a fair value.
Prices: EODHD daily closes of Bitcoin, Ethereum, the S&P 500 and gold to 18 September 2026; crypto on every day, the S&P 500 and gold on Monday–Friday closes. On-chain series: ETH Chronicles project (IDA), November 2014 to 8 October 2025. LPPL: nonlinear parameters (tc, m, ω) from the lecture notebook; the linear step is computed in the browser.