

The slide of the lecture is on the left, the same figure on the right, computed in the browser from the same data. The ▶ button moves the parameter step by step.
Motivation for a Crypto Index · Constructing CRIX · Our Replication on Real Data · The Real CRIX, 2017–2026 · VCRIX: A Volatility Index · Investible Index Products
Motivation for a Crypto Index
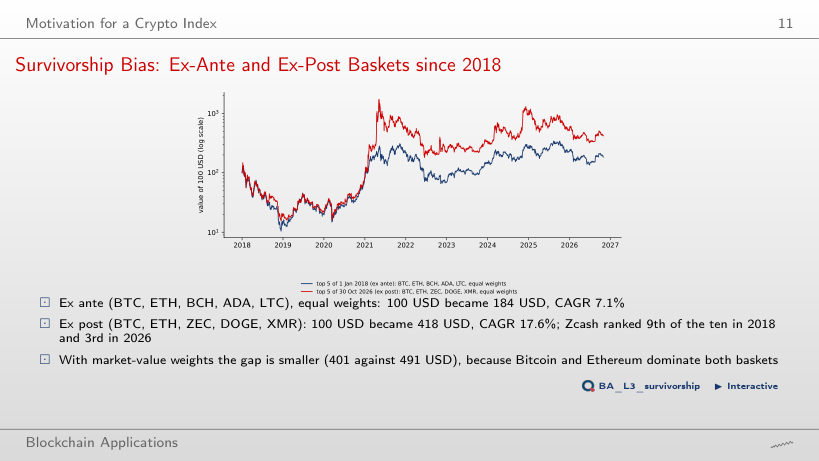
Survivorship Bias: Ex-Ante and Ex-Post Baskets since 2018
Answer
Very large: the ex-ante top 5 of 1 January 2024 (BTC, ETH, ADA, DOGE, LTC) returned −3.0% a year to 30 October 2026, the ex-post top 5 (BTC, ETH, ZEC, DOGE, XMR) 129.8% a year. The shorter the period, the more an ex-post list is made of the recent winners: Zcash enters the top 3 only after its rise in 2025–2026. From 1 January 2018 the gap is 17.6% against 7.1% a year; with N = 2 it disappears, because Bitcoin and Ethereum are the top two at both dates.
Constructing CRIX
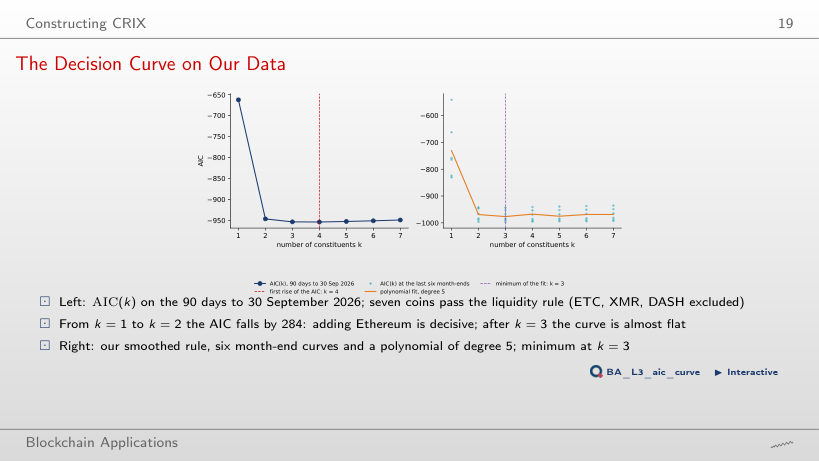
The Decision Curve on Our Data
Answer
In 9 of 35 quarters; 3 constituents in 13, 4 in 11, 5 and 6 once each (mean 3.2). The curve always falls steeply from k = 1 to k = 2 (adding Ethereum) and is almost flat after that, so the choice between 2, 3 and 4 moves from quarter to quarter. The smoothed AIC rule (six months, polynomial) chooses 3 in 30 of the 35 quarters: smoothing over six months makes the number of constituents more stable.
Our Replication on Real Data
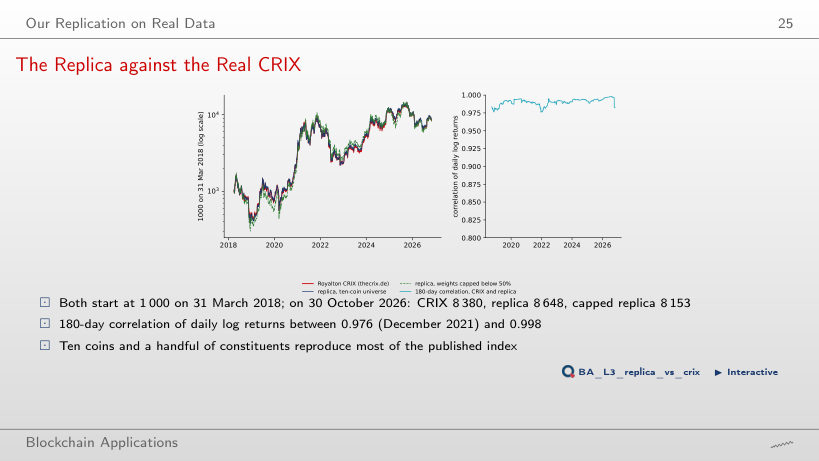
The Replica against the Real CRIX
Answer
All choices with 3 to 7 coins are close: tracking error 9.0% (top 5) to 9.4% (top 3) a year, correlation 0.989–0.990; the AIC rules give 9.3%. Bitcoin alone (top 1) has 15.6% and correlation 0.971; the top 2 has 10.0%. Capping the weights below 50% raises the tracking error of the ECRIX replica from 9.3% to 14.5%. Beyond the first two or three coins the remaining gap comes from coins outside our ten-coin universe, not from the rule.
The Real CRIX, 2017–2026
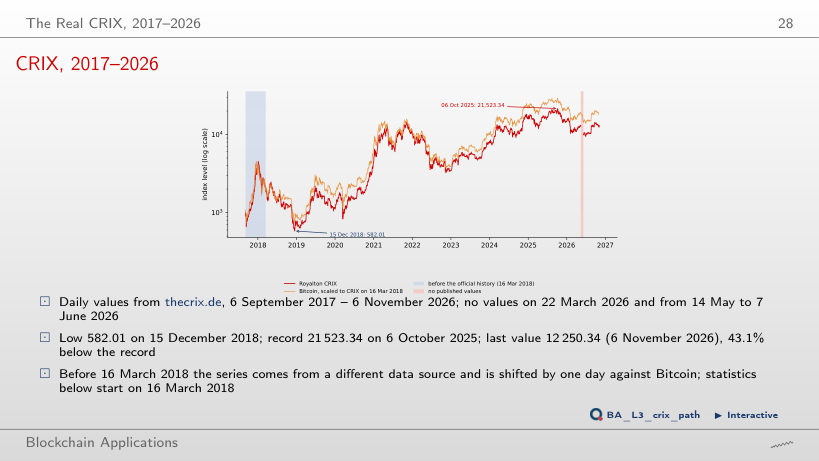
CRIX, 2017–2026
Answer
No: CAGR 40.4% for CRIX against 49.3% for Bitcoin, with volatility 47.4% against 46.1% and maximum drawdowns of −56.1% against −53.1%. Over the official history (16 March 2018 – 31 October 2026) the picture is the same: 24.0% against 29.4% a year. In this period Bitcoin's share of the market rose, so a market-value index of many coins grew more slowly and was not less volatile.
Drawdowns of CRIX and Bitcoin
Answer
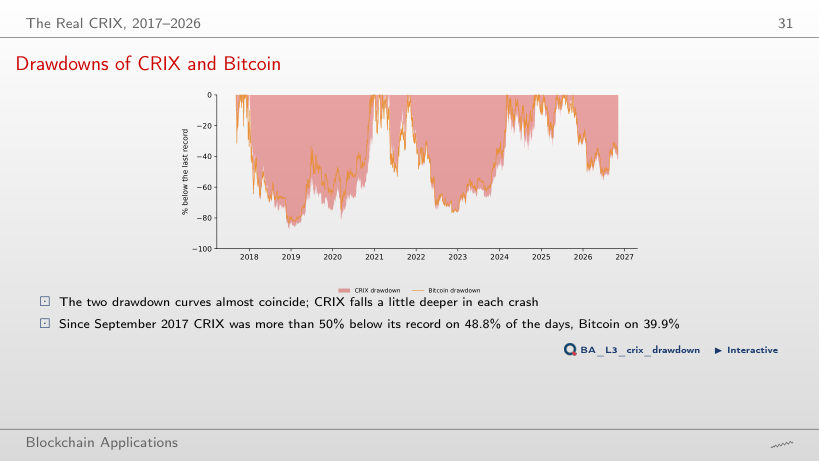
17.5% of the days for CRIX and 9.5% for Bitcoin. CRIX has two falls deeper than 70%: 2018 (−87.1%, record again on 31 December 2020) and 2021–2022 (−77.4%, record again on 11 November 2024). The broad index stays deeper under water for longer than Bitcoin, because the smaller coins fall more in crypto winters.
VCRIX: A Volatility Index
VCRIX, 2018–2026
Answer
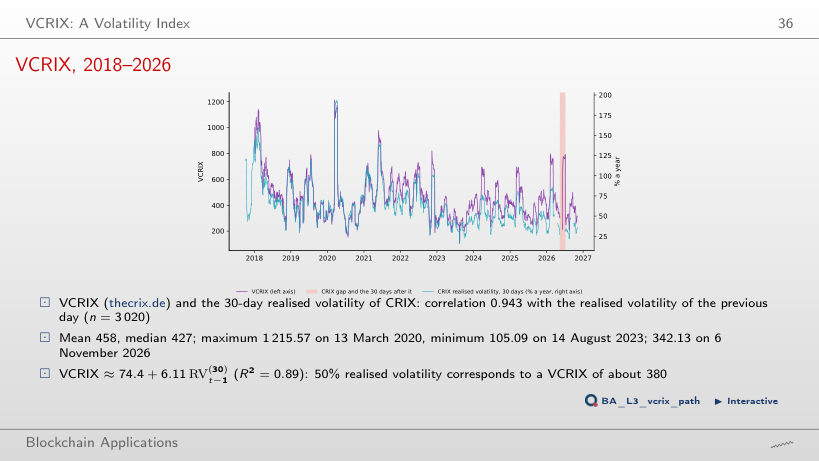
At exactly 30 days: correlation 0.943 (21 days 0.873, 45 days 0.839, 90 days 0.657); a scan of every window from 5 to 120 days peaks at 30. This is consistent with the construction of VCRIX on a 30-day realised volatility (Kim, Trimborn and Härdle, 2021). With the same-day volatility the correlation is lower, 0.930: VCRIX on day t reflects the returns up to day t − 1.
Volatility after Falls and Rises
Answer
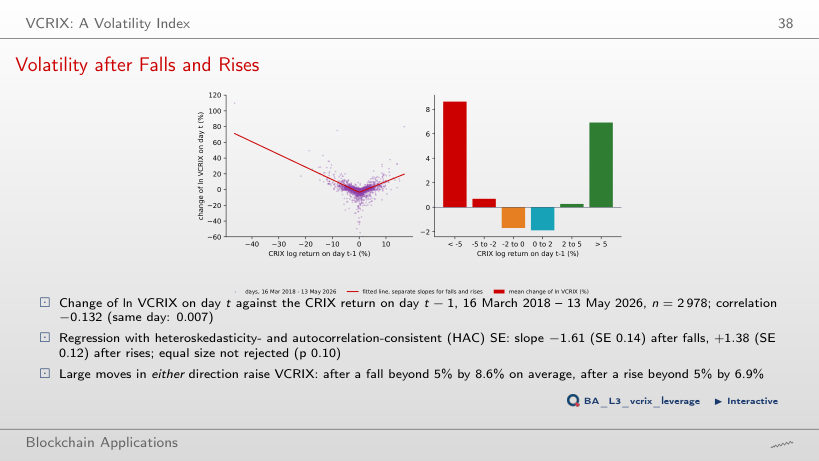
After the 35 falls of more than 10% the log of VCRIX rises by 21.6% on average, after the 19 rises of more than 10% by 18.3%; on the other days it falls slightly (−0.4%). Large moves in either direction raise the volatility index; the effect after falls is somewhat larger, as the leverage effect suggests, but rises also raise it, because VCRIX is built from squared returns.
VCRIX against GARCH and Realised Volatility
Answer
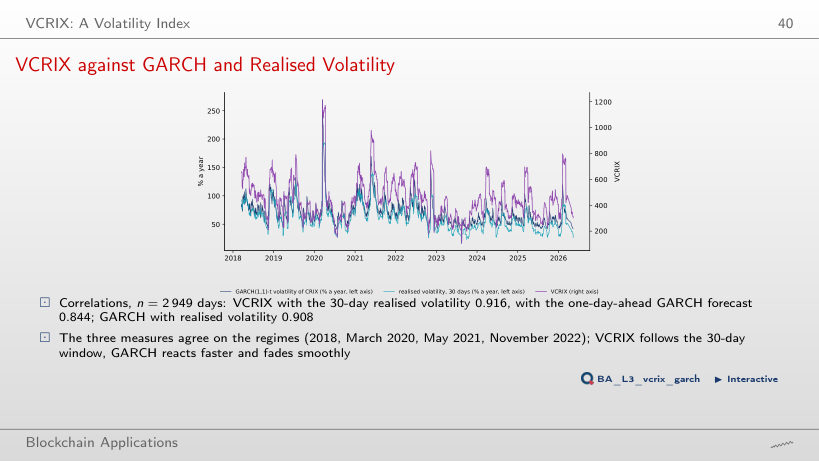
At k = −1: 0.931, against 0.916 at k = 0, i.e. VCRIX on day t matches the 30-day realised volatility of day t − 1. For the GARCH one-day-ahead volatility the maximum is at k = 0 (0.844), since it is already a forecast made on day t − 1. For positive k the correlations fall (GARCH 0.53 at k = +10): VCRIX does not anticipate future volatility better than the two models.
Investible Index Products
A Spot Bitcoin Fund against Bitcoin
Answer
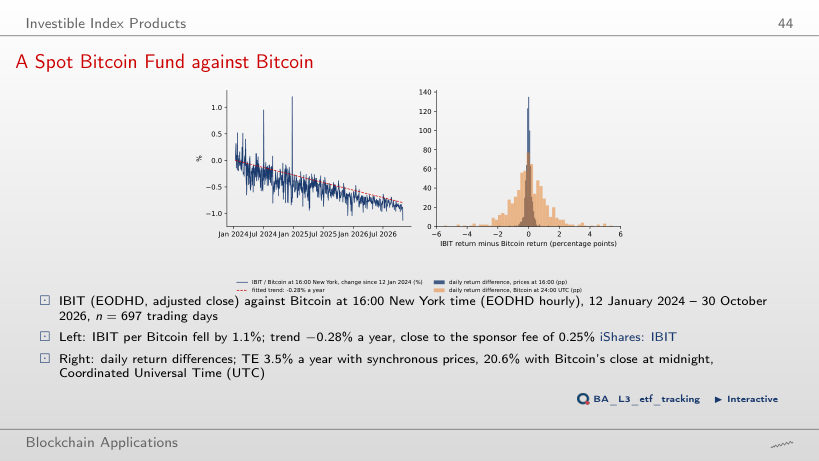
With Bitcoin at 16:00 New York the tracking error falls to 1.7% a year (from 3.5% since January 2024), with Bitcoin at 24:00 UTC it is still 16.1%: most of the latter is the time gap between the two prices, not the fund. The tracking difference with synchronous prices stays near −0.26% a year, close to the sponsor fee of 0.25%; with midnight prices it is a noisy −0.06%.
Royalton CRIX and VCRIX: daily values from the chart data of thecrix.de (CRIX 6 September 2017 – 6 November 2026, VCRIX from 4 January 2018; no values on 22 March, 14 May – 7 June, 31 August and 5 November 2026). Coins: EODHD daily closes and volumes to 30 October 2026, current supply from the Coin Metrics Community API; market value = price × supply. IBIT: EODHD adjusted close; Bitcoin at 16:00 New York from EODHD hourly prices. Replica rules and GARCH estimates: Slides/code/l3_indices.py.