

The slide of the lecture is on the left, the same figure on the right, computed in the browser from the same data. The ▶ button moves the parameter step by step.
Volatility Models · Estimates · Value-at-Risk and Expected Shortfall · Backtesting · Out of Sample: 19 September – 23 October 2026
Volatility Models
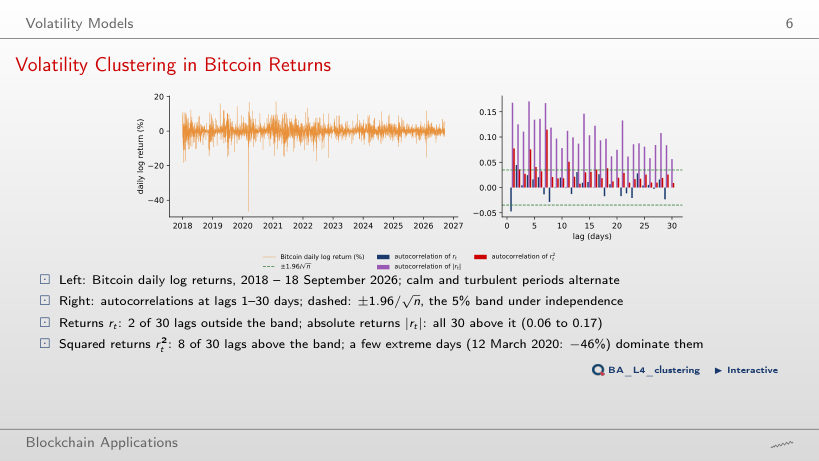
Volatility Clustering in Bitcoin Returns
Answer
26, and 28 to 30 when more days are capped; the largest autocorrelation rises from 0.11 to 0.15. The squared return of that day, 46.5² = 2,162, dominates the sum of squares in the denominator of every autocorrelation, so one day hides the dependence that the other 3,182 days show. Absolute returns do not have this problem: all 30 lags lie above the band with or without capping. For returns the count stays at 2 of 30.
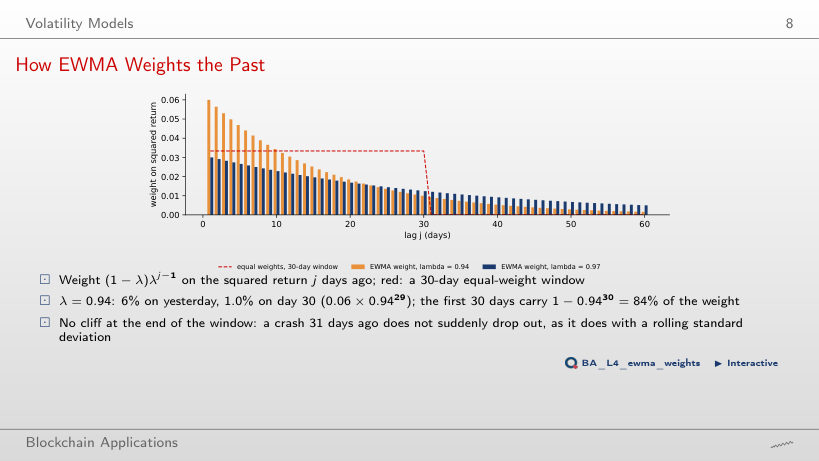
How EWMA Weights the Past
Answer
It falls: 1 − λ³⁰ is 99.9% at λ = 0.80, 60% at λ = 0.97 and 26% at λ = 0.99; a higher λ spreads the weight over a longer past (effective memory 1/(1 − λ) from 5 to 100 days). λ is the weight of yesterday's variance estimate, not of yesterday's return, whose weight is 1 − λ: 20% at λ = 0.80, 1% at λ = 0.99. On 11 April 2020, when the crash of 12 March leaves a 30-day window, the equal-weight volatility drops from 197% to 106% a year; the EWMA with λ = 0.94 only from 124% to 121%.
Estimates
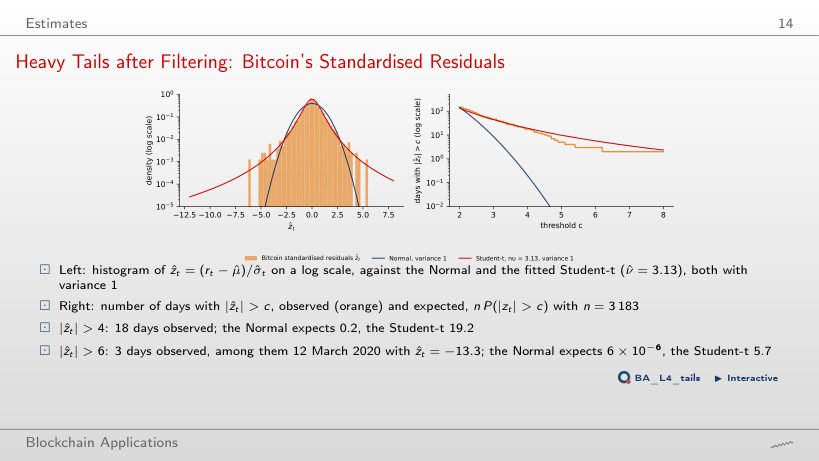
Heavy Tails after Filtering: Bitcoin's Standardised Residuals
Answer
About 5.7, almost twice the 3 observed. Up to c ≈ 4 the fitted Student-t (estimated ν = 3.13) matches the counts; beyond about 4.5 it expects more extreme days than occurred: 9.9 against 5 at c = 5, and 2.3 against 2 at c = 8. The Normal expects 6.3 × 10⁻⁶ days beyond 6 in this sample, about one such day in 1.4 million years of daily data; the largest observed, 12 March 2020, has ẑ = −13.3. Both counts beyond 5 rest on a handful of days, so the excess of the Student-t is a weak signal.
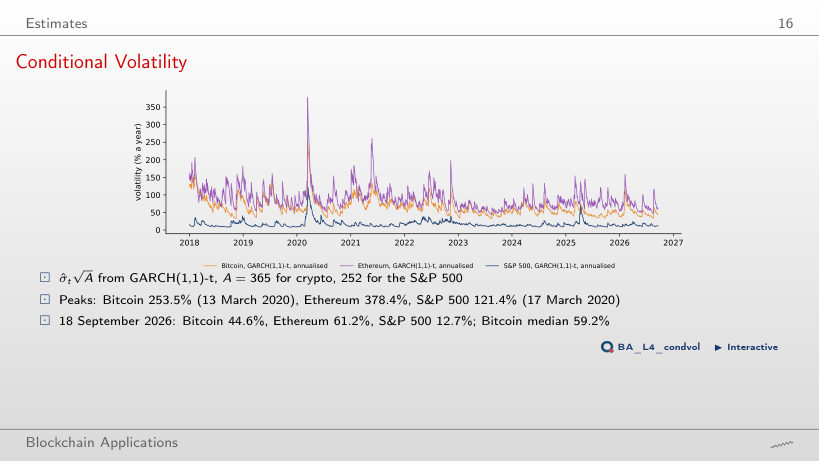
Conditional Volatility
Answer
It rises with α: 148.6% at 0.25 times the estimate (α = 0.019), 253.5% at the estimate (α = 0.076) and 392.6% at 2.5 times (α = 0.190). α is the weight of yesterday's squared shock, so a larger α turns the crash of 12 March 2020 into a larger jump of the next day's variance; the persistence α + β decides how long a shock lasts, not how large the jump is. The median moves the other way, from 78.6% to 52.6% a year.
Volatility Forecasts by Horizon after a Shock
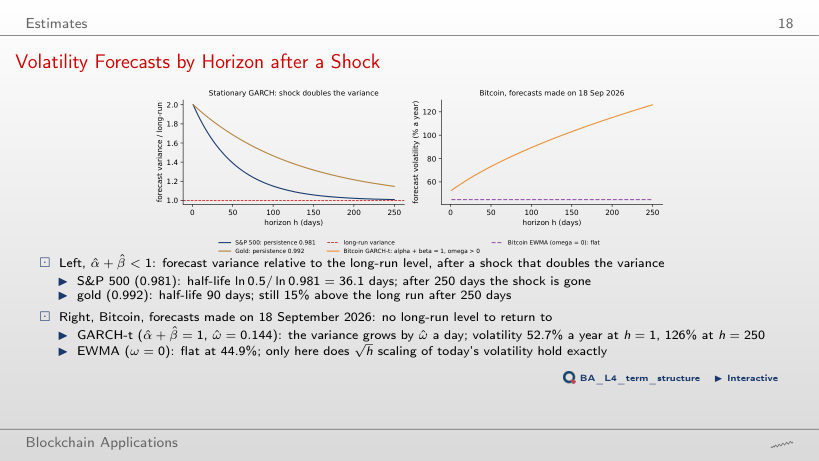
Answer
It stays at 36.1 days (gold: 90.0 days). The gap between the forecast and the long-run variance is multiplied by the estimated α + β = 0.981 each day, whatever its size, so it halves in ln 0.5 / ln 0.981 = 36.1 days for every shock, also for a variance below the long run (0.25 times), from which the forecast rises. After 250 days the ratio is 1.025 for the largest shock and 0.994 for the smallest. Bitcoin has no half-life: with estimated α + β = 1 the forecast variance rises by ω = 0.144 a day, from 52.7% a year at h = 1 to 126% at h = 250.
Value-at-Risk and Expected Shortfall
VaR and ES on the Forecast Density
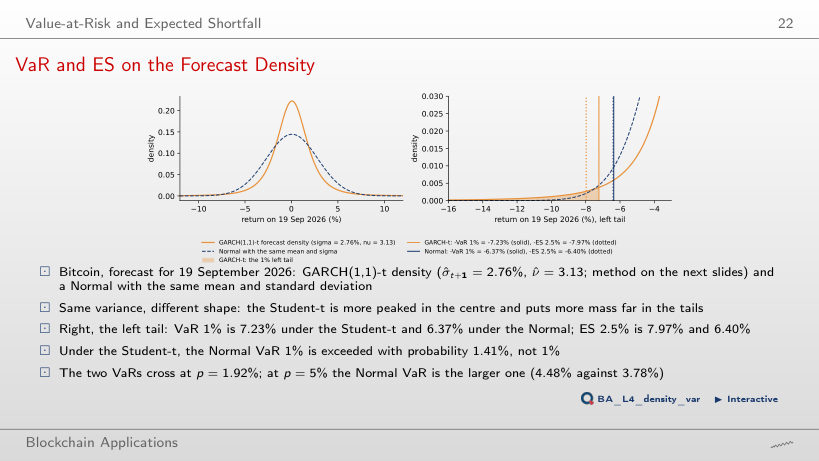
Answer
It falls: 7.18% at ν = 3, 6.55% at ν = 2.5, below the Normal's 6.37% once ν < 2.44, and 2.85% at ν = 2.05. With σ fixed, a Student-t with ν close to 2 puts its variance into extremely rare, very large losses and concentrates the rest near zero, so its 1% quantile shrinks. Raising ν from the estimate the other way, the VaR first rises to about 7.28% near ν = 3.5 and then falls towards the Normal value (6.50% at ν = 30). ES 2.5% falls below the Normal value (6.40%) once ν < 2.23. Heavier tails do not always mean a larger VaR at a given level; the crossing level of the two VaR curves moves from 1.92% to 0.12%.
VaR and ES by Method
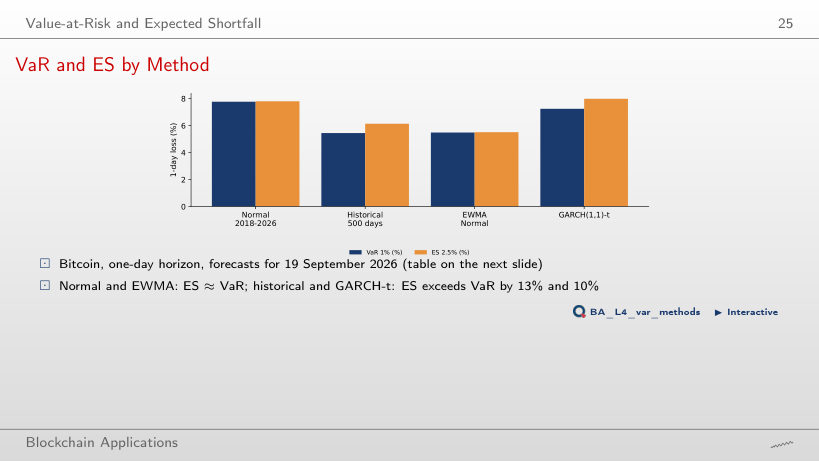
Answer
GARCH-t, by far: 15.90% against 10.31% for the Normal. The Student-t with estimated ν = 3.13 has much heavier tails, so its quantile grows faster as p falls; at p = 1% the larger σ of the Normal (3.35% a day over 2018–2026, against a GARCH-t forecast of 2.76% for 19 September 2026) still dominates. At p = 5% the Normal is higher again, 5.46% against 3.78%. Historical simulation at 0.1% takes the worst returns of the last 500 days: 11.24%.
Backtesting
Violations Through Time
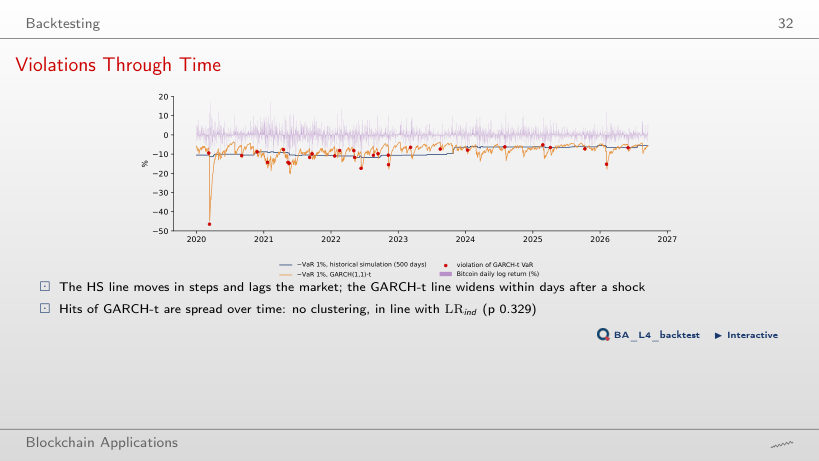
Answer
No. GARCH-t has 5 to 7 hits, the amber zone, in 23% of the 250-day windows (among them the windows ending between June 2022 and February 2023); it never reaches the red zone. A model can pass the full-period tests (28 hits against 24.5 expected) and still spend long periods in amber. EWMA is amber or red in 76% of the windows and reaches 10 hits in 2026; the Normal in 50%, with 10 hits in August 2024; historical simulation in 11%.
Out of Sample: 19 September – 23 October 2026
Bitcoin VaR, Rolled Forward
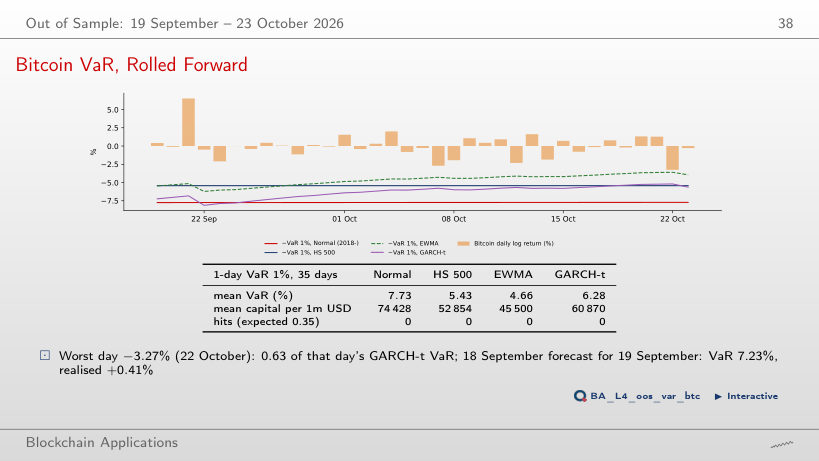
Answer
0.98³⁵ = 0.493, against 0.99³⁵ = 0.703 for a correct 1% VaR. No hit is almost as likely for the wrong model as for the right one, so these five weeks cannot separate them: the Kupiec statistic for no hit is 0.70 (p-value 0.40). Telling a 2% from a 1% hit rate with power 0.8 at the 5% level needs about 905 days.
Prices: EODHD daily closes of Bitcoin, Ethereum, the S&P 500 and gold; estimation sample 1 January 2018 – 18 September 2026, out-of-sample window 19 September – 23 October 2026. GARCH(1,1)-t parameters and the 2020–2026 VaR forecasts (GARCH-t re-estimated every 21 days) come from the lecture notebook; the variance filter, VaR, ES and the backtest statistics are computed in the browser.