

The slide of the lecture is on the left, the same figure on the right, computed in the browser from the same data. The ▶ button moves the parameter step by step.
Comparing Different Anchors · Quantile Regression and the Lasso · The De-pegging Pressure Index · Tail Dependence between Stablecoins
Comparing Different Anchors
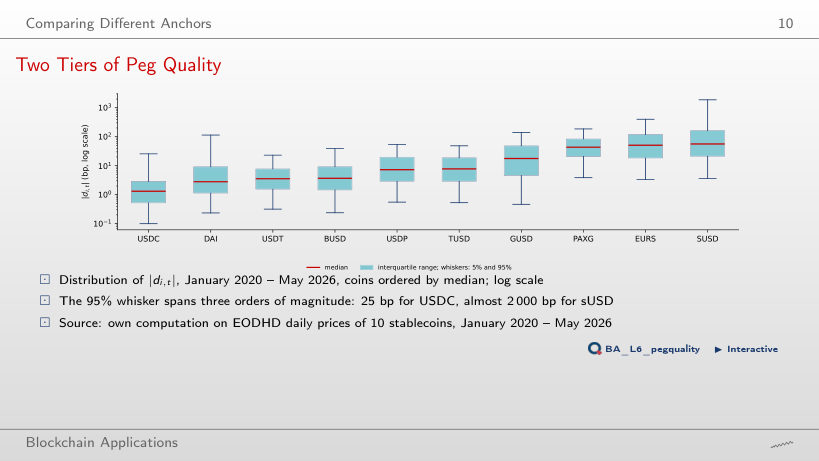
Two Tiers of Peg Quality
Answer
It roughly doubles, to 3,929 bp, while the median rises only from 56.3 to 62.1 bp and the share of days at least 100 bp below the peg from 26.0% to 30.3%. The 145 added days are the collapse of sUSD to 0.09 USD: they are 6% of the sample, but they fill the upper tail. The other nine coins change much less, and the two tiers keep the same members.
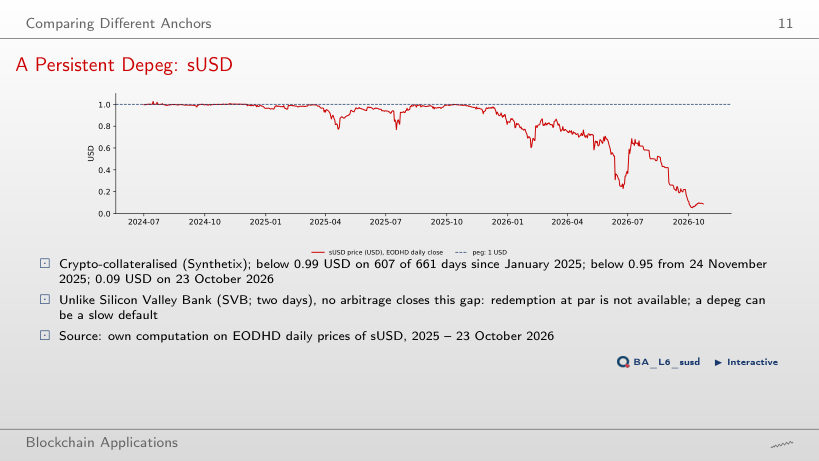
A Persistent Depeg: sUSD
Answer
From 20 August 2026; it first closed below 0.50 on 12 June 2026, and on 23 October 2026 it closed at 0.09 USD. The fall from 0.95 to 0.50 took about nine months, with returns above each level before it was left for good. No arbitrage at par closes this gap, because redemption at 1 USD is not available: the depeg is a slow default, not a weekend dislocation.
Quantile Regression and the Lasso
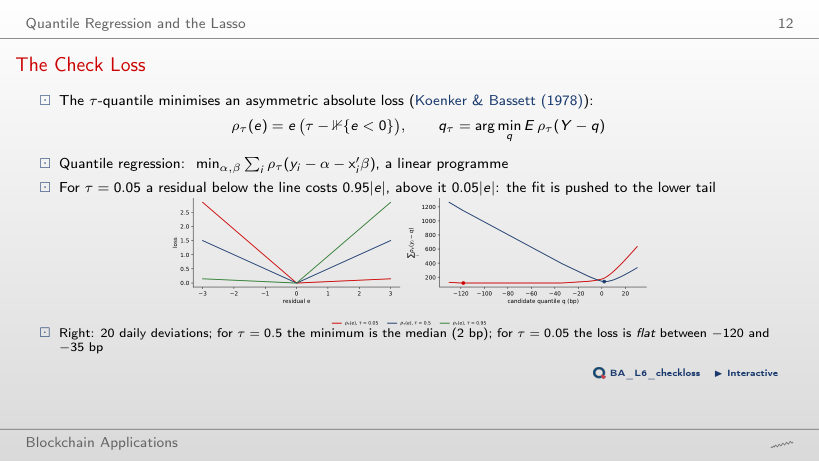
The Check Loss
Answer
Every q from −35 to −12 bp, the second and third smallest observations: n τ = 2 is again an integer, so the loss is flat between two observations (total loss 148.10). Whenever 20 τ is an integer the minimiser is an interval; for other τ it is one observation (τ = 0.06: q = −35 bp). For τ = 0.5 the interval is [2, 3] bp, around the median of 2 bp quoted on the slide. In a 90-day window n τ = 4.5, so the 5% quantile is unique, but still set by five days.
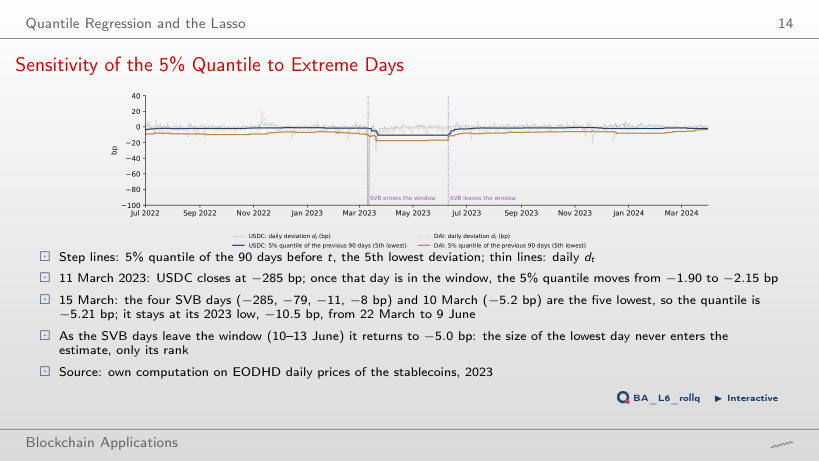
Sensitivity of the 5% Quantile to Extreme Days
Answer
From W = 20 days down. The 5% quantile of W values is the value of rank ⌊0.05 (W − 1)⌋ + 1 from the bottom; it is the lowest value only while 0.05 (W − 1) < 1, that is W ≤ 20. With W = 21 to 30 it is the second lowest of the window to 11 March (−5.21 bp, the close of 10 March), and from 15 March the second SVB close, −79.3 bp. A short window gives a quantile that jumps with single days; a long window gives one that ignores how deep the worst day was.
Worked Example: the Quantile Lasso Equation for USDC after SVB
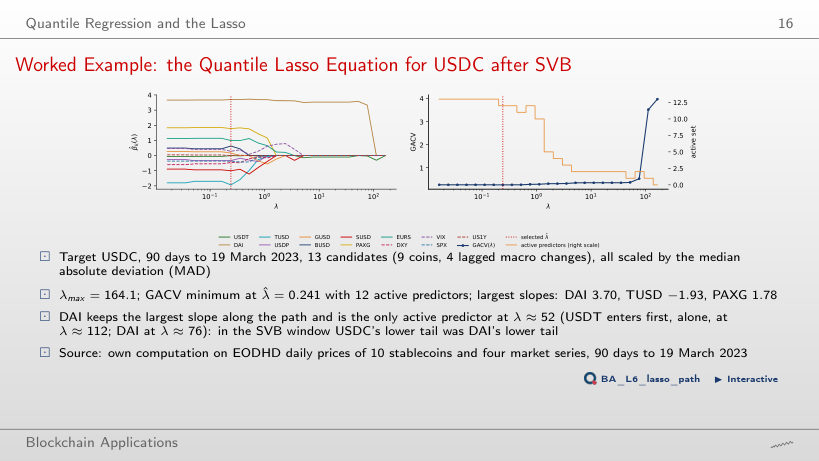
Answer
No. It goes 0, 1, 2, then back to 1 (at λ = 51.9 USDT leaves and only DAI is active), 2 up to λ = 5.2, then 3, 4, 5, 10, 12, 11, 12, 12 and 13. The Lasso path of a quantile regression is not monotone: a predictor can leave when others enter. At the selected λ̂ = 0.241 twelve of the 13 are active; the one left out is USDT, which is active at the neighbouring λ values.
The De-pegging Pressure Index
The DPI, April 2020 – October 2026
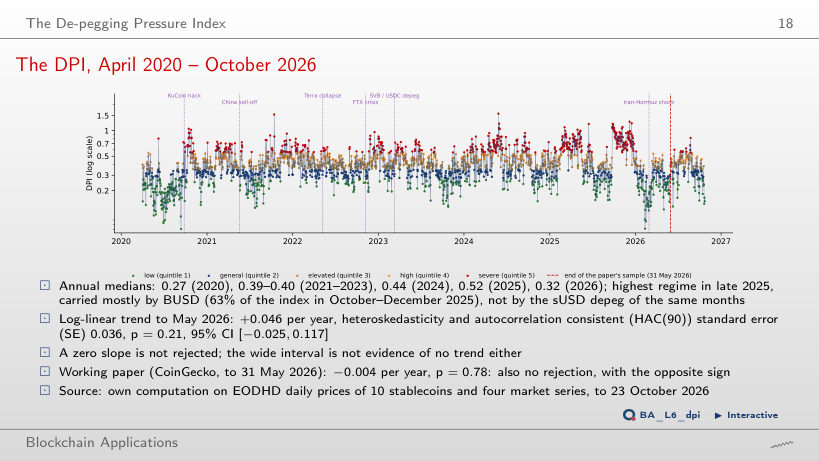
Answer
Yes: +0.088 a year, HAC(90) standard error 0.032, p = 0.01, 95% interval [0.026, 0.151]. Adding the first five months of 2026, when the DPI was lower (annual median 0.32 against 0.52 in 2025), brings the slope to +0.046 and the p-value to 0.21; to 23 October 2026 it is +0.035 (p = 0.25). The test result depends on where the sample ends, which is one more reason to read the DPI in regimes, not as a trend.
Contributions of Individual Coins to the DPI
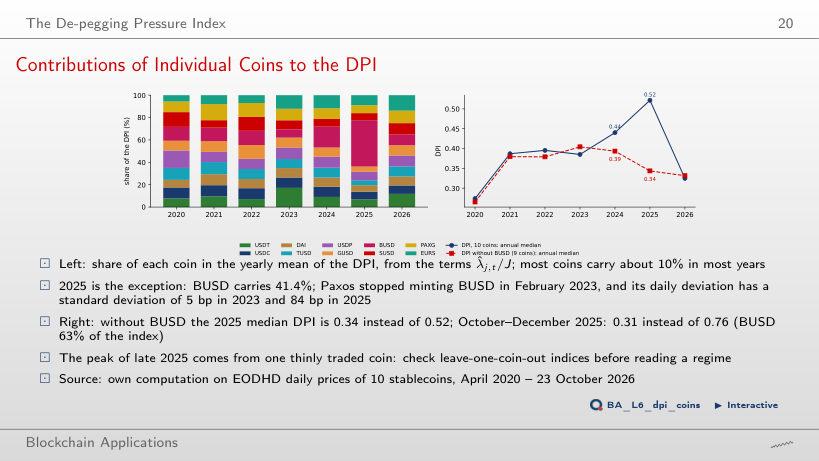
Answer
None by more than 0.02: without EURS the 2025 median is 0.50; without PAXG 0.52, without USDC 0.52; leaving out any of the other six raises it, to between 0.53 (USDP) and 0.56 (TUSD), because the weight of BUSD then rises from 1/10 to 1/9. Leaving out sUSD gives 0.55: the late-2025 peak does not come from the sUSD depeg. Leaving out BUSD changes the whole index most (correlation of the logs 0.82; 0.96 to 0.98 for the other coins).
Robustness of Event Responses
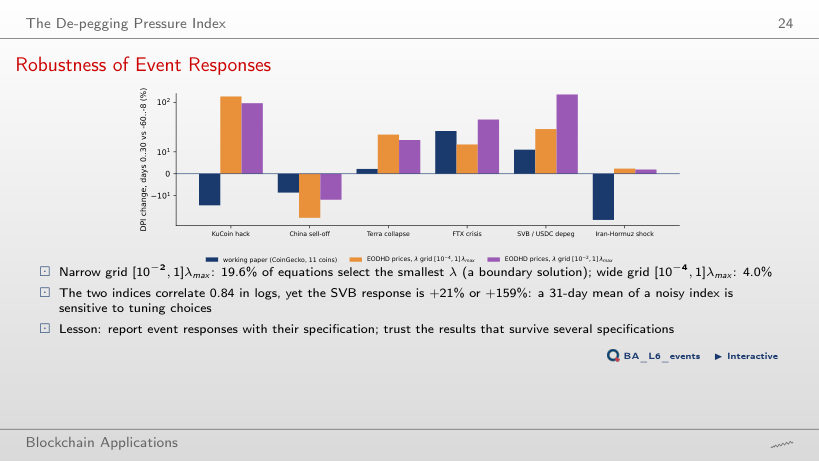
Answer
KuCoin (+49.6%), Terra (+23.5%) and the Iran–Hormuz shock (−34.8%, Holm p = 0.049); the China sell-off is no longer significant (−12.5%, Holm p = 0.123). The window length changes which events respond, and even the sign: the Iran–Hormuz response is −35% over 10 days and +2.4% over 30. Neither window gives FTX and SVB, the two events the paper finds significant. The narrow-λ-grid index on this page is re-estimated with the notebook (+94.9% for KuCoin and +158.6% for SVB at 30 days; the lecture reports +95.3% and +158.6%).
Tail Dependence between Stablecoins
Tail Links between Stablecoins: Signed Selection Frequencies
Answer
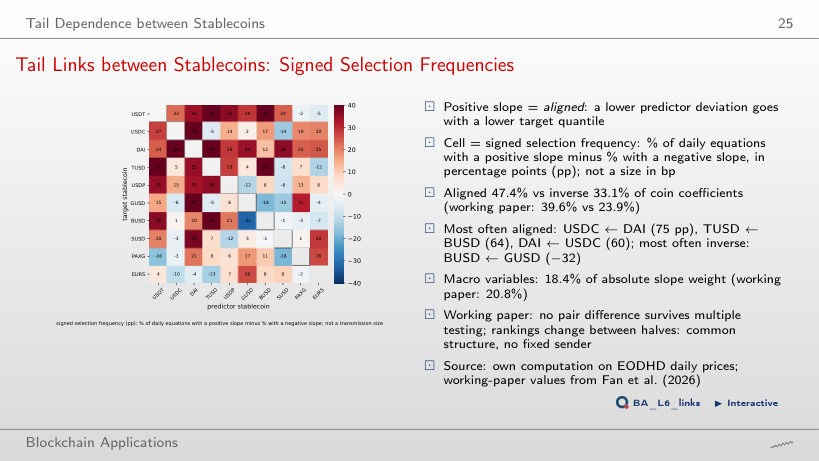
In 1 of the 7, 2023, the year of the SVB weekend (91 pp). In every other year another pair leads: USDT ← BUSD and USDP ← BUSD in 2020, TUSD ← BUSD in 2021, USDP ← TUSD in 2022, BUSD ← USDT in 2024 and 2026, TUSD ← USDT in 2025. The pooled ranking averages different years; the shares of aligned (44–51%) and inverse (29–37%) coefficients are more stable than the ranking of pairs. This matrix uses the notebook's Quantile Lasso; its pooled values agree with the slide to the unit (market variables: 18.3% here, 18.4% in the lecture).
Model Sparsity across DPI Quintiles
Answer
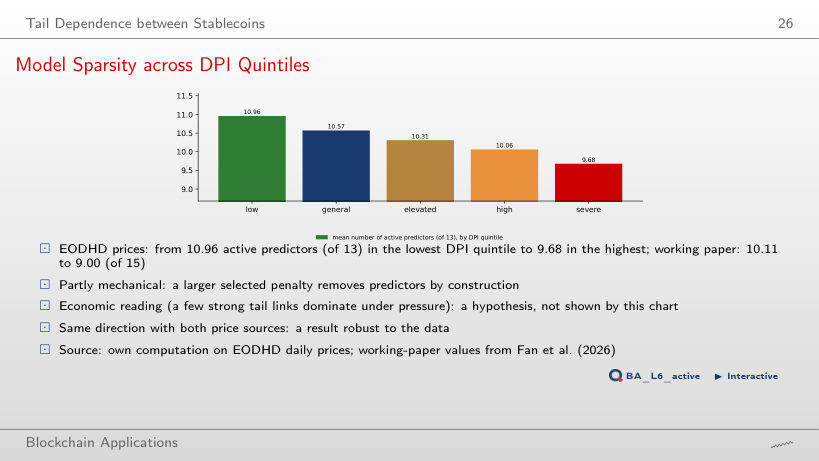
It widens: 11.06 active predictors in the lowest decile against 9.51 in the highest, and the mean falls from each decile to the next. The Spearman correlation of the daily DPI with the mean active set is −0.73. Part of this is mechanical: the DPI is the mean selected λ, and a larger λ removes predictors by construction.
Prices: EODHD daily closes of ten stablecoins, EUR/USD and gold (reference adjustment), January 2020 to 23 October 2026. DPI, selected penalties and active sets: the daily estimates of the lecture (10 coins, 90-day windows, 5% Quantile Lasso, λ chosen by GACV, 2,397 days). The narrow-grid DPI on the event windows and the link matrix use the Quantile Lasso of the lecture notebook. Event responses of the paper: Fan, Sha, Härdle and Pele (2026).