

The slide of the lecture is on the left, the same figure on the right, computed in the browser from the same data. The ▶ button moves the parameter step by step.
Crypto Markets as Networks · Cryptocurrencies as an Asset Class · Event Studies: Ethereum Upgrades
Crypto Markets as Networks
Correlation Matrix and Minimum Spanning Tree
Answer
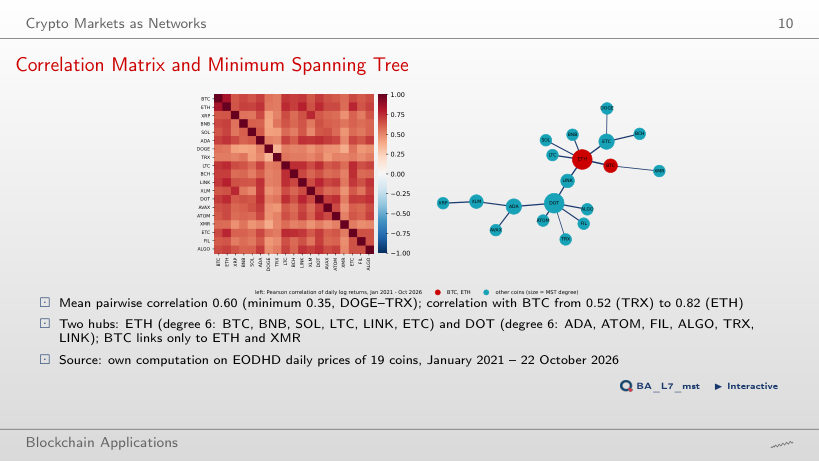
Polkadot (DOT): it is the hub in 2022 (degree 5), 2023 (degree 9), 2024 (5) and 2025 (5). Litecoin is the hub in 2021 (5); in 2026, to 23 October, Bitcoin, Ether and Ethereum Classic share the highest degree (4). Over the full sample ETH and DOT tie with degree 6. The MST keeps the 18 strongest links that connect all coins, so a hub is a coin that is the nearest neighbour of many others, not the largest coin: Bitcoin has degree 1 in 2021 and 2 in 2025. The mean pairwise correlation is highest in 2022 (0.73) and lowest in 2024 (0.55).
Eigenvalues of the Correlation Matrix and the Absorption Ratio
Answer
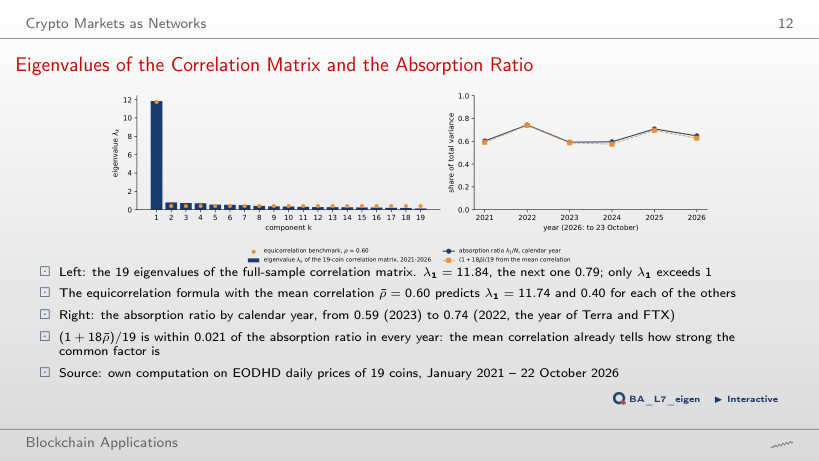
2022: λ₁ = 14.12 and the absorption ratio λ₁/19 is 0.743, against 0.592 in 2023, the lowest year. 2022 is the year of the Terra and FTX collapses, when the mean pairwise correlation reached 0.725. In every year the formula (1 + 18ρ̄)/19 from the mean correlation is within 0.021 of the absorption ratio, so the year with the highest mean correlation is also the year with the strongest common factor. Only one eigenvalue exceeds 1 in 2022 and 2025; in 2024 three do (λ₂ = 1.27), a sign of a second, weaker factor.
Rolling Correlation and Absorption Ratio, 2021–2026
Answer
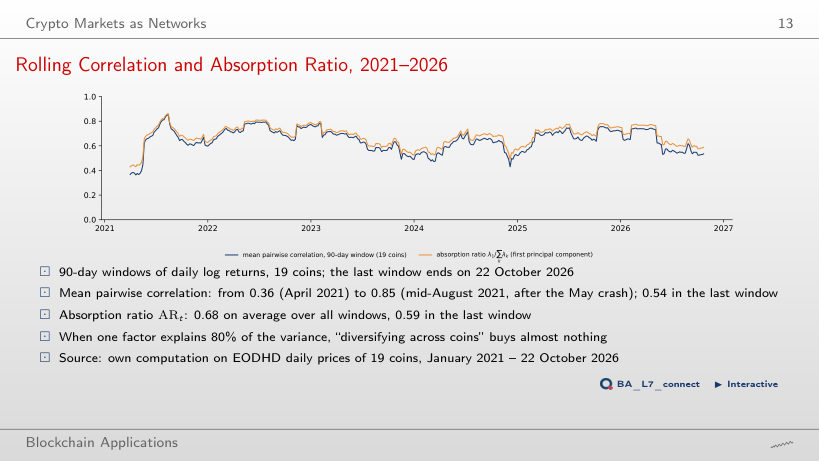
It falls, from 0.90 (30-day window ending 15 June 2021) to 0.85 (90 days, 14 August 2021) and 0.75 (360 days). A long window averages the days after a crash with calmer days, so the peaks of co-movement are smoothed away; the lowest value rises from 0.28 to 0.49. The average absorption ratio hardly moves, from 0.69 to 0.67: the window changes how sharply the episodes show, not the overall level of connectedness.
Spillovers through Time
Answer
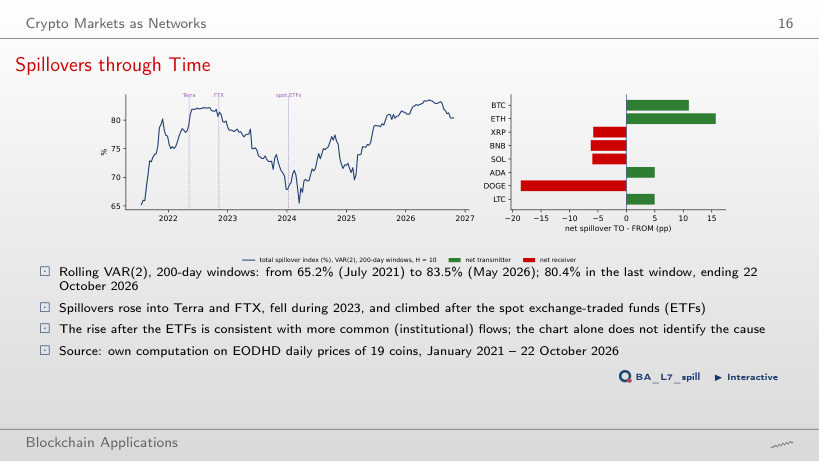
It hardly changes: for the full-sample VAR(5) it is 72.7% at H = 1, 72.9% at H = 10 and 72.9% at H = 20; in the last 200-day window it moves from 80.3% to 80.4%. The lag coefficients of daily crypto returns are small, so almost all of the forecast-error variance comes from the same-day correlation of the shocks (Σ), which is already in the H = 1 decomposition. A high spillover index here measures common same-day moves, not shocks that travel from coin to coin over the following days.
Cryptocurrencies as an Asset Class
Classification Map of 33 Assets
Answer
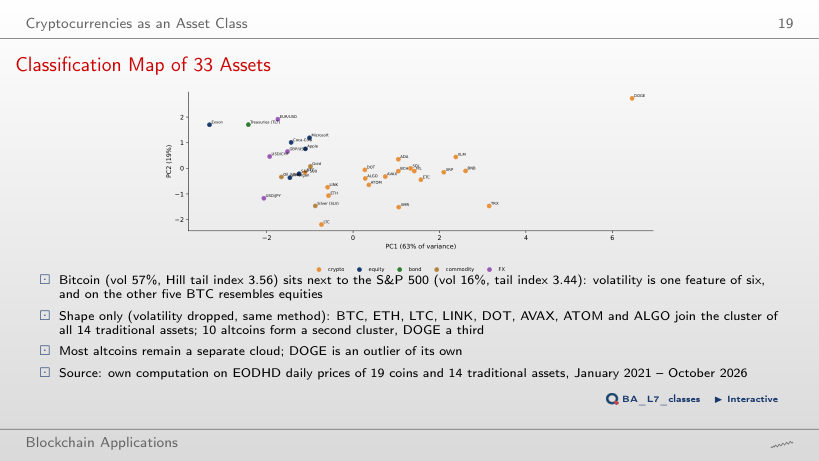
It falls, from 8 coins to 4. With weight 0 to 0.15 the group holds BTC, ETH, LTC, LINK, DOT, AVAX, ATOM and ALGO; from 0.2 to 0.45, seven (AVAX leaves); from 0.5 on, only BTC, ETH, LTC and LINK. All 14 traditional assets stay in the same group at every weight. Volatility separates most altcoins from traditional assets; on the shape of the returns alone, the large coins resemble equities. PC1 explains 62.7% of the variance with all six features and 64.5% with shape only.
Event Studies: Ethereum Upgrades
Significance of Individual CARs
Answer
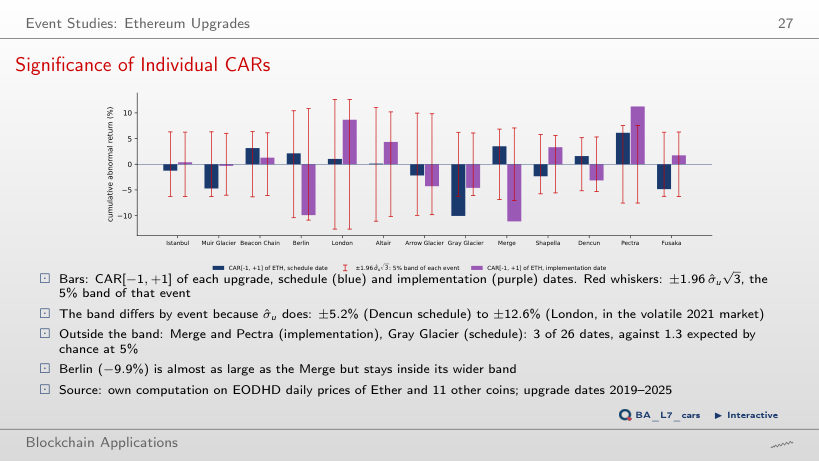
Between 2 and 5 at every window: 5 for [−1, 0], 3 for [−1, +1], then 2 to 4. The Merge and Pectra implementation dates are outside in every window from [−1, +1] on (the Merge reaches −23.3% at [−1, +10], Pectra +24.8%); the others enter and leave. With 26 dates and a 5% test, about 1.3 would lie outside by chance in each window. A longer window adds noise to every CAR and widens every band by the same factor √L, so it does not create new significant events.
Abnormal Returns around the Event Day
Answer
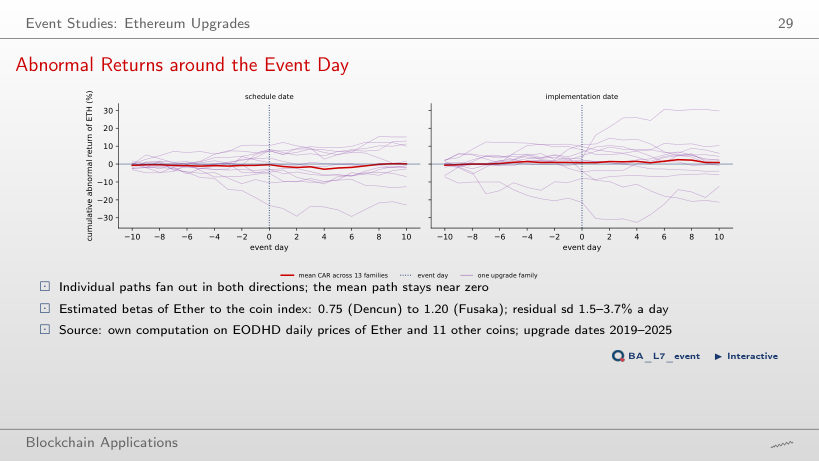
No. The mean CAR[−1, τ₂] stays between −0.25% and +1.51%, and the cross-sectional test never comes near rejection: |t| ≤ 0.53, p ≥ 0.61 for every τ₂. The individual paths fan out as the window lengthens, because each CAR adds more daily noise (residual sd 1.5–3.7% a day), but the mean does not drift. The schedule dates give the same picture: the lowest p-value is 0.17, for [−1, +4].
Prices: EODHD daily closes to 23 October 2026; 19 coins from 2 January 2021 (2,121 daily log returns); equities, Treasuries, silver and oil funds (adjusted closes), the S&P 500, gold and four exchange rates (Monday–Friday closes, repeated closes removed). Correlations, minimum spanning trees, absorption ratios, VAR spillovers, principal components, k-means groups and event-window tests are computed in the browser from the returns, features and abnormal returns of the lecture notebook.