

The slide of the lecture is on the left, the same figure on the right, computed in the browser from the model outputs of the lecture. The ▶ button moves the parameter step by step.
Machine-Learning Forecasts of Bitcoin's Direction · Data Snooping · Risk Forecasts: Classical, ML and Pretrained
Machine-Learning Forecasts of Bitcoin's Direction
Overfitting and Feature Contributions
Answer
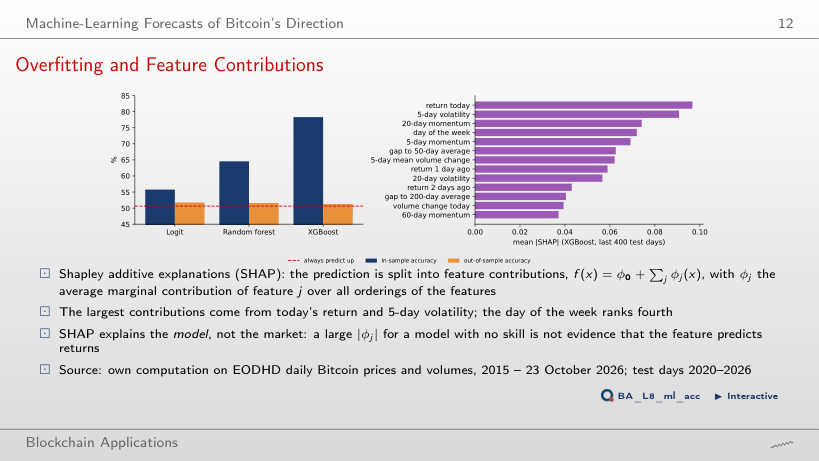
At none of the 40. In-sample, XGBoost fits 74–85% of past days; out of sample its accuracy on a 63-day block ranges from 38% to 67%. The random forest also never does better out of sample; the logit, which fits only 54–58% in sample, does better at 13 of the 40 origins. A flexible model learns the noise of the training days, so its in-sample accuracy says little about new days. Out of sample, XGBoost beats "always up" in 15 of the 40 blocks, and over all 2,487 test days it scores 51.3% against a base rate of 50.6%.
Trading the Signals
Answer
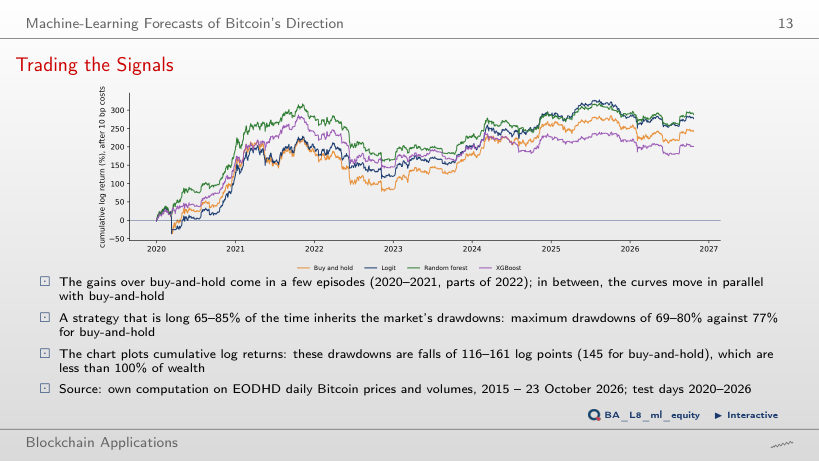
XGBoost: its Sharpe ratio falls from 0.89 (no cost) to 0.63 (10 bp) and −0.43 (50 bp); it changes position about 125 times a year. The random forest (81 changes a year) falls from 0.97 to 0.19 and the logit (70 a year) from 0.85 to 0.22. Buy-and-hold pays the cost once and stays at 0.59. XGBoost falls below buy-and-hold at about 12 bp, the logit at about 21 bp and the random forest at about 25 bp. The Sharpe ratio before costs does not rank the strategies after costs: turnover does.
Data Snooping
810 Trading Rules
Answer
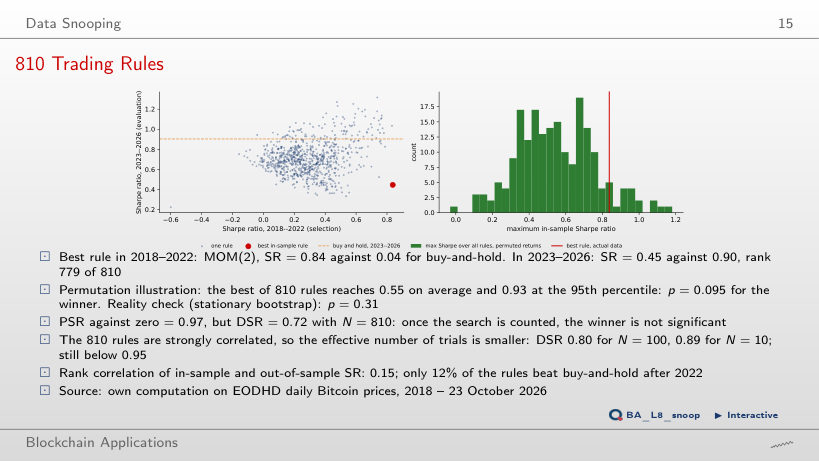
Only for N = 2 (DSR 0.953). The benchmark SR₀, the best annualised Sharpe ratio expected by chance, rises from 0.09 (N = 2) to 0.22 (N = 5), 0.29 (N = 10), 0.46 (N = 100) and 0.58 (N = 810); the DSR falls from 0.95 to 0.92, 0.89, 0.80 and 0.72. The PSR against zero, 0.97, ignores the search. The rules are strongly correlated, so the effective N is below 810, but even 5 independent trials leave the winner below 0.95. Out of sample (2023–2026) MOM(2) has a Sharpe ratio of 0.45 against 0.90 for buy-and-hold.
Risk Forecasts: Classical, ML and Pretrained
Model Rankings by Breach Rate and by Quantile Score
Answer
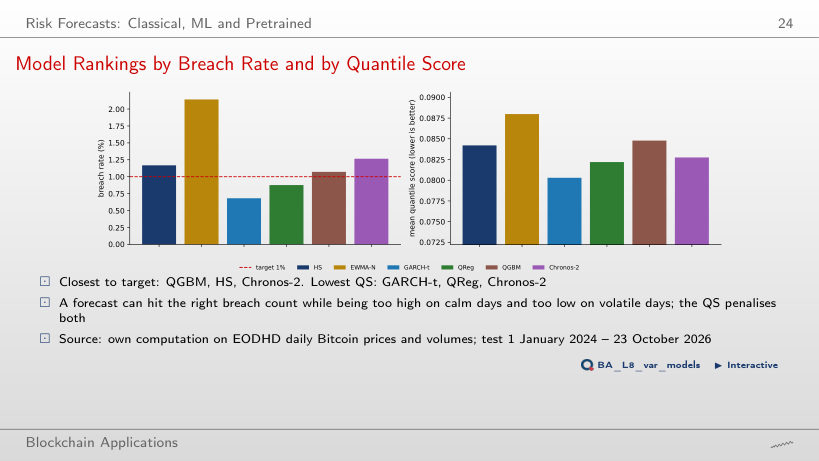
The ranking by mean quantile score. From May 2024 on, GARCH-t has the lowest mean QS at every month end; QReg is lowest in the first four months. The model closest to the 1% breach target changes 10 times, among five models (HS, GARCH-t, EWMA-N, QReg, QGBM). With 10.3 breaches expected in 1,027 days, one breach more or less moves a breach rate by 0.1 percentage point, while the QS uses the size of the miss on every day.
VaR Paths of the Tree Model and GARCH-t
Answer
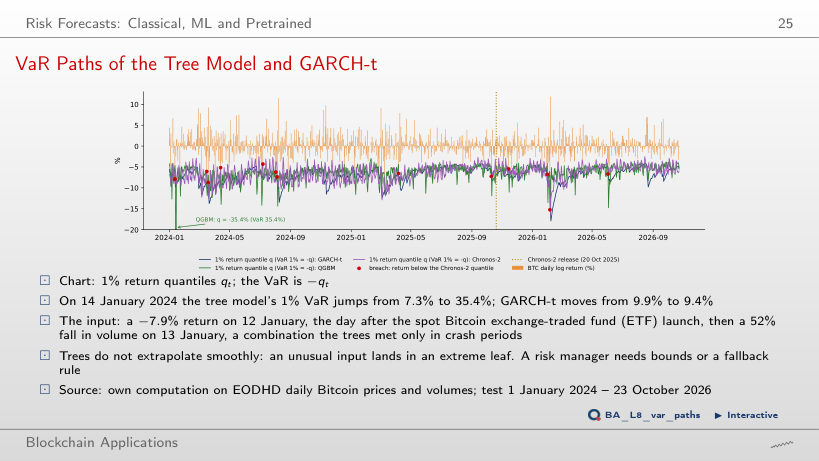
8.1%: the jump lasts one day. On 14 January the trees received a −7.9% return on 12 January followed by a 52% fall in volume on 13 January, a combination met in training only in crash periods; on 15 January the inputs (return −2.5%, volume −15%) fall in an ordinary leaf again. GARCH-t moves smoothly, from 9.9% (13 January) to 9.4% and 9.2%; a variance recursion cannot jump like this, and a tree forecast has no memory from one day to the next.
Rolling Quantile Scores Relative to GARCH-t
Answer
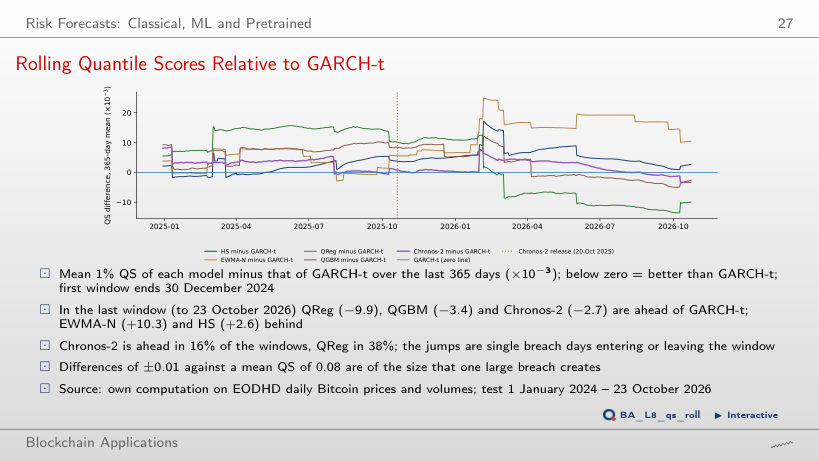
It falls from 59% (60-day windows) to 14% (365 days) and to 0% from 480 days on. A 1% VaR is breached on about one day in a hundred, so most short windows contain no breach of either model; on such days a lower VaR scores better, and EWMA-N, with its thin Normal tail, usually has the lower VaR. Long windows contain the breaches, where its thin tail costs most. Short windows therefore reward the wrong model; the other models show the same pattern: Chronos-2 is ahead in 60% of the 60-day windows and in 13–22% of the windows of 300 days or more.
Prices and volumes: EODHD daily closes of Bitcoin to 23 October 2026. Direction forecasts: walk-forward probabilities of the logit, random forest and XGBoost (40 refits, test 1 January 2020 – 22 October 2026) and the Sharpe ratios of the 810 trading rules, from the lecture notebook. VaR: one-day forecasts of HS, EWMA-N, GARCH-t, QReg, QGBM and Chronos-2 (amazon/chronos-2, revision 29ec376), test 1 January 2024 – 23 October 2026. Accuracies, back-tests, deflated Sharpe ratios, breach tests and quantile scores are computed in the browser from these outputs.