

The slide of the lecture is on the left, the same figure on the right, computed in the browser from the same data. The ▶ button moves the parameter step by step.
What a Stablecoin Promises · Measuring the Peg · Automated Market Makers and Price Formation · Early Warning · Recent Data: August to October 2026
What a Stablecoin Promises
Issuers of On-Chain Dollars
Answer
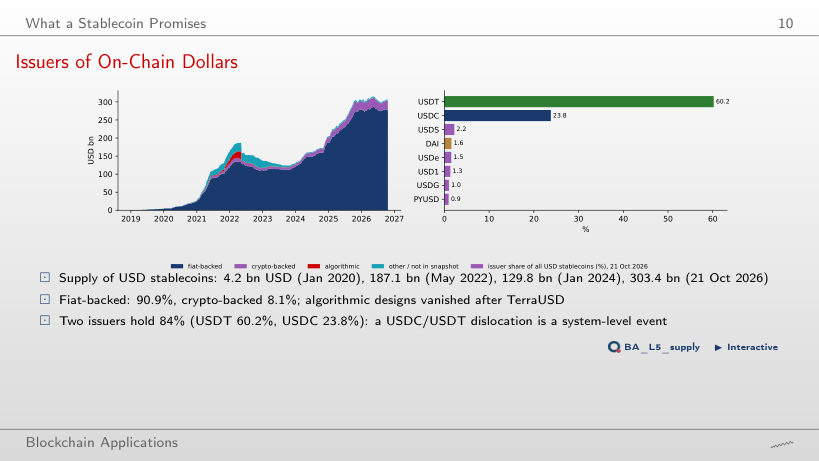
About 11%: 11.5%, or 21.3 USD bn. Three weeks later, on 31 May 2022, the algorithmic share was 0.9%, and in October 2026 it is 0.0%; fiat-backed tokens hold 90.9% and crypto-backed tokens 8.1%. TerraUSD was large, but never the largest: on 8 May 2022 Tether held 45.0% and USD Coin 26.1% of the supply.
Measuring the Peg
Daily Peg Deviations of Three Stablecoins
Answer
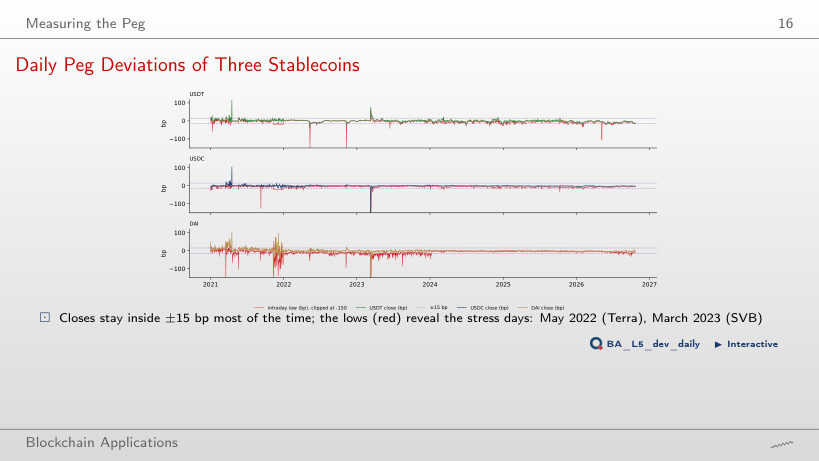
DAI, with 0.57% of days (12 of 2,122). USDT and USDC are beyond 50 bp on 0.14% of days each (3 days). USDT is the coin most often beyond 15 bp, but its deviations are small and persistent; USDC has the deepest close (−285 bp on 11 March 2023), but only on a few days. How often a coin breaches a threshold depends on the threshold: the ranking at 15 bp does not carry over to 50 bp.
Tails and Their Frequency
Answer
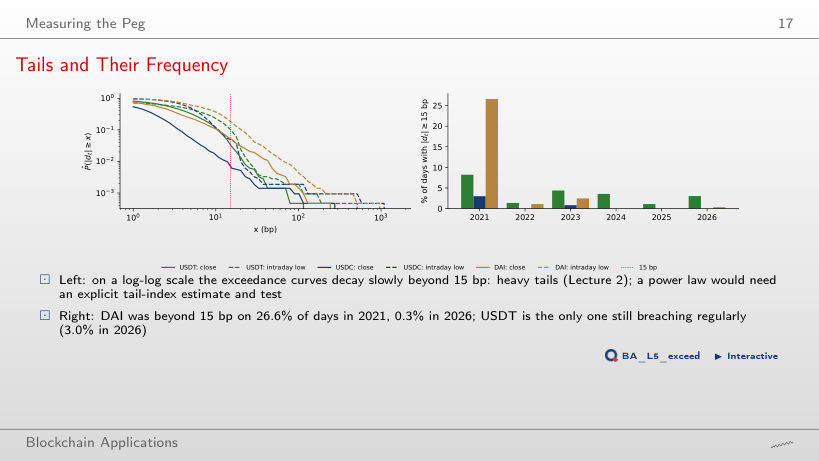
None. In 2026 (to 23 October) no close of USDT, USDC or DAI is 25 bp or more from 1 USD; at 20 bp only USDT has any (0.34% of days). The tails are heavy over 2021–2026 as a whole, because of 2021, May 2022 and March 2023; in 2026 the deviations are small. A heavy tail of the full sample does not mean that large deviations occur every year.
Rolling 1% VaR of Peg Deviations
Answer
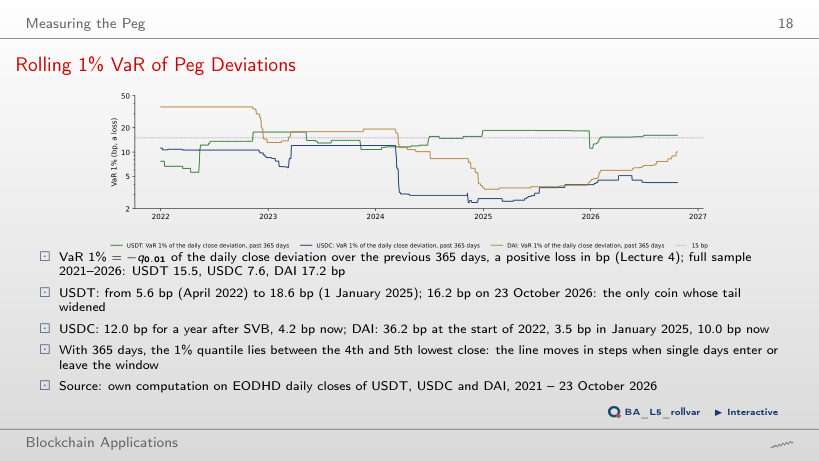
About 102 bp, on 12 March 2023, and it stays at 50 bp or more for 89 days. With 90 days the 1% quantile lies at position (90 − 1) × 0.01 = 0.89 between the lowest close (−285 bp) and the second lowest (−79.3 bp): −285 + 0.89 × 205.7 = −101.9 bp. With 365 days it lies between the 4th and 5th lowest, which is why one extreme day hardly moves it. A short window reacts strongly to a single day and forgets it after W days; a long window barely sees it.
The SVB Weekend, Hour by Hour
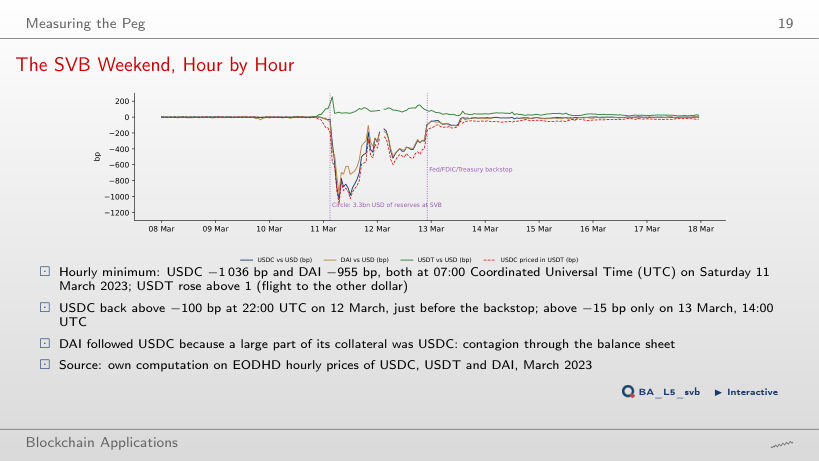
Answer
For 8 hours, all on Saturday 11 March between 06:00 and 14:00 UTC (at 08:00 it was −771 bp). From 15:00 UTC on Saturday the price stayed above the value that a total loss of the SVB deposit implies, although it returned above −100 bp only at 22:00 UTC on Sunday 12 March and above −15 bp at 14:00 UTC on Monday 13 March. With a recovery rate R = 0.5 the value is −412 bp, and USDC was below it for 22 hours.
Automated Market Makers and Price Formation
Price Response of an AMM Pool to Imbalance
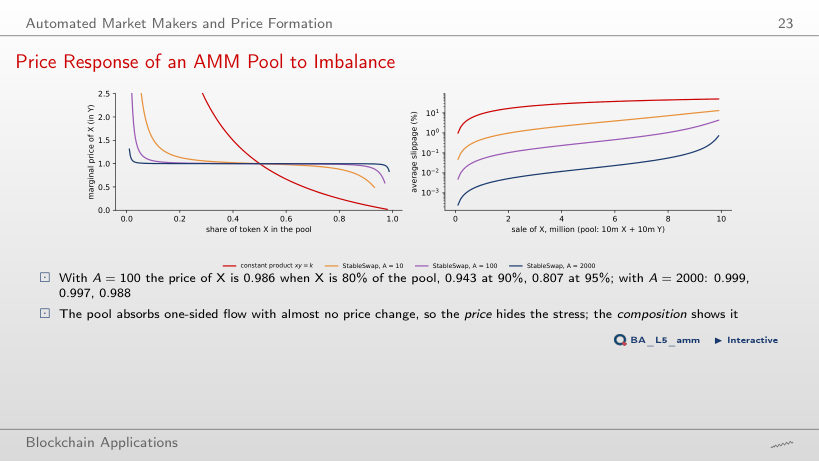
Answer
Between 90% and 95% of the pool: the price is 0.9914 at 94.0% and 0.9898 at 94.5%. With A = 100 it falls below 0.99 already at about 76%, with A = 10 at about 55%; in a constant-product pool any imbalance moves the price (0.99 at a share of 50.3%). A high amplification keeps the price near 1 until the pool is almost one-sided: the price says little about the stress, the composition says much more.
Early Warning
Duration and Depth of Episodes
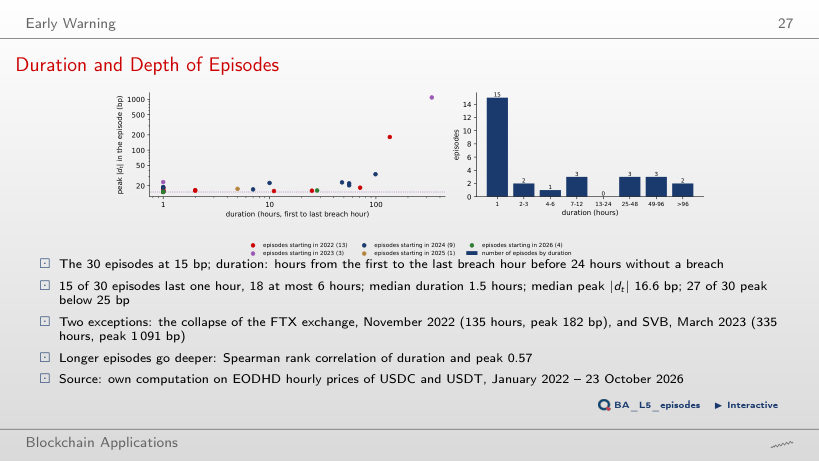
Answer
5 episodes, with a median duration of 7 hours; 2 of them last more than a day. A higher threshold keeps fewer, longer and deeper events: the median peak is 33.6 bp, against 16.6 bp at 15 bp. At 50 bp only 2 episodes remain, the FTX collapse (November 2022) and the SVB weekend (March 2023). An episode beyond 25 bp has also crossed 15 bp, but at 15 bp it is counted inside a longer episode that started earlier.
Worked Example: Computing the Utility
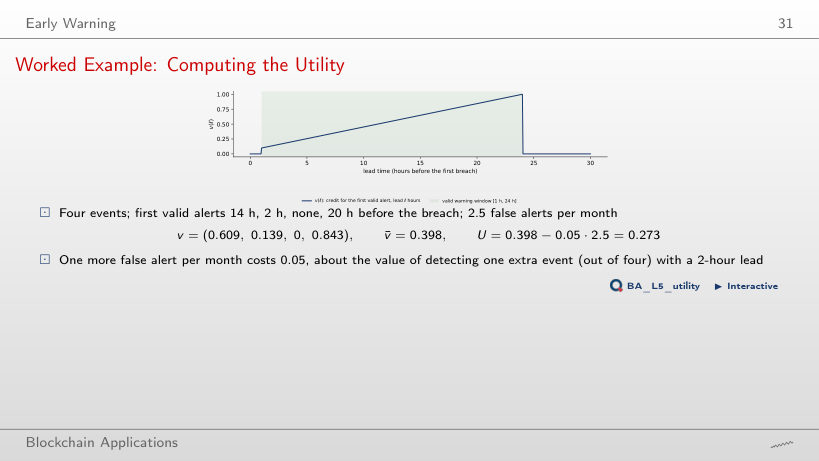
Answer
At 7.96 false alerts a month: the mean credit of the four events, 0.398, divided by the cost of 0.05 per false alert a month. 0.273 / 0.05 = 5.46 is the number of false alerts a month that can be added to the 2.5 already counted. The budget of 2 false alerts a month is a constraint on the choice of the alert threshold, not the point where U changes sign.
Results: Four Classifier Families
Answer
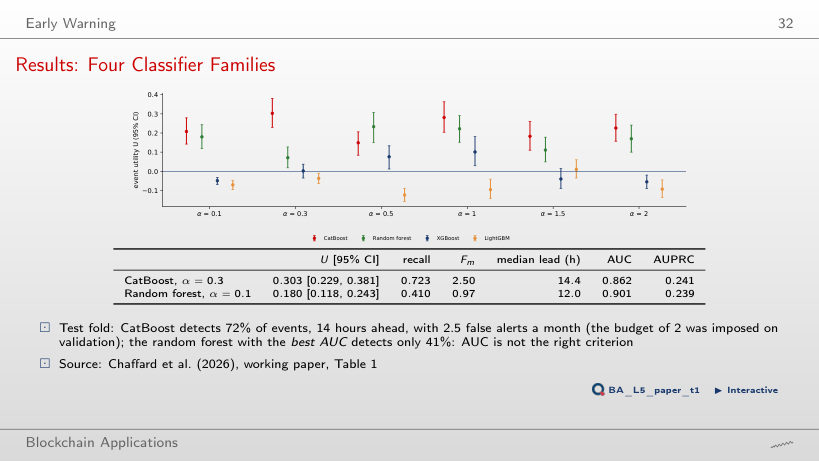
For 5 of the 6. At α = 0.5 the random forest is higher (0.233 against 0.149). XGBoost and LightGBM never have the highest U; LightGBM has a negative U for five of the six values. Overlapping 95% intervals of CatBoost and the random forest do not change the ranking of the point estimates; they show that the ranking is uncertain.
The Recall–False-Alert Trade-off
Answer
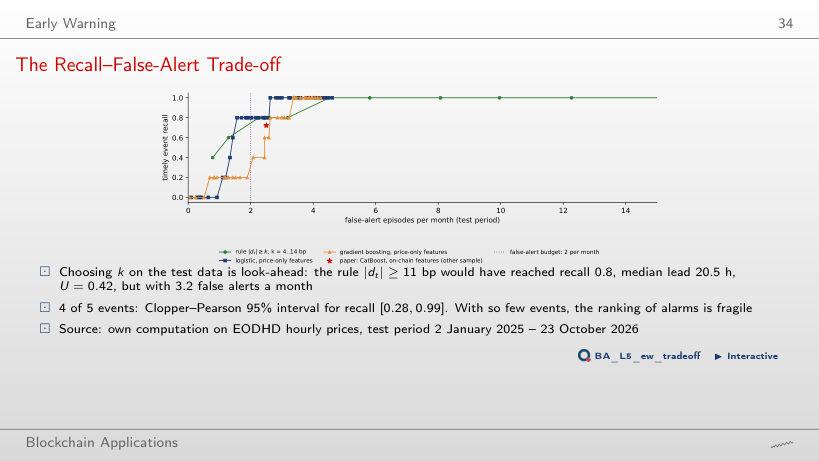
3 of the 5, at k = 13 bp, with 1.29 false alerts a month and U = 0.340 (Clopper–Pearson 95% interval for the recall [0.15, 0.95]). At k = 12 bp the rule has 2.26 false alerts a month. This k is chosen with hindsight on the test data; the rule chosen on 2024 under the same budget is k = 20 bp, which detects none of the test events. At k = 15 bp, the event threshold itself, the rule detects nothing in time: it fires only once the breach has started.
Recent Data: August to October 2026
The Last Twelve Weeks
Answer
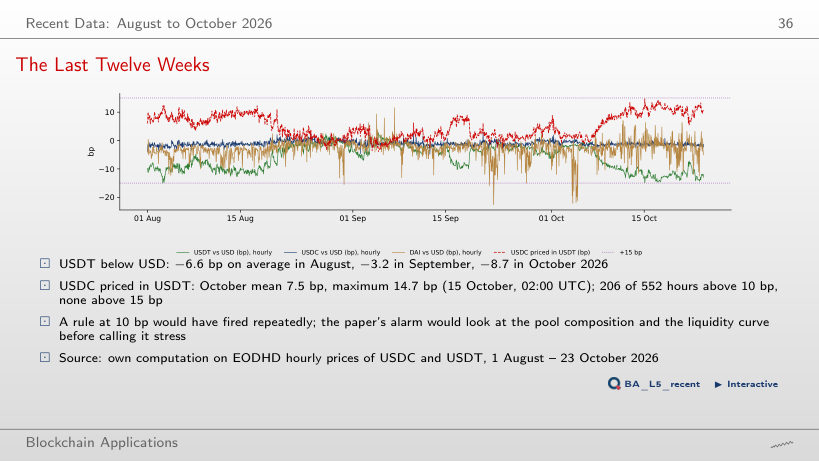
24, about two a week, none of them followed by a breach of 15 bp. The refractory period merges consecutive hours above 10 bp into one episode, so the count is far below the number of hours. With k = 12 bp there are 10 episodes, with k = 14 bp 2. A level rule cannot tell a persistent small discount of USDT from stress; the alarm of the paper also looks at the pool composition and the liquidity curve.
Prices: EODHD daily closes and intraday lows (2021 to 23 October 2026) and hourly closes (January 2022 to 23 October 2026). The rolling VaR 1% and the episodes are recomputed in the browser from these prices. Stablecoin supply: DefiLlama snapshot of 21 October 2026. Results of the paper: Chaffard et al. (2026), Table 1. The price-only alarms (logistic regression, gradient boosting) are fitted in the lecture notebook; the page evaluates their test-period scores and the rule |dt| ≥ k with the event-level protocol of the lecture.