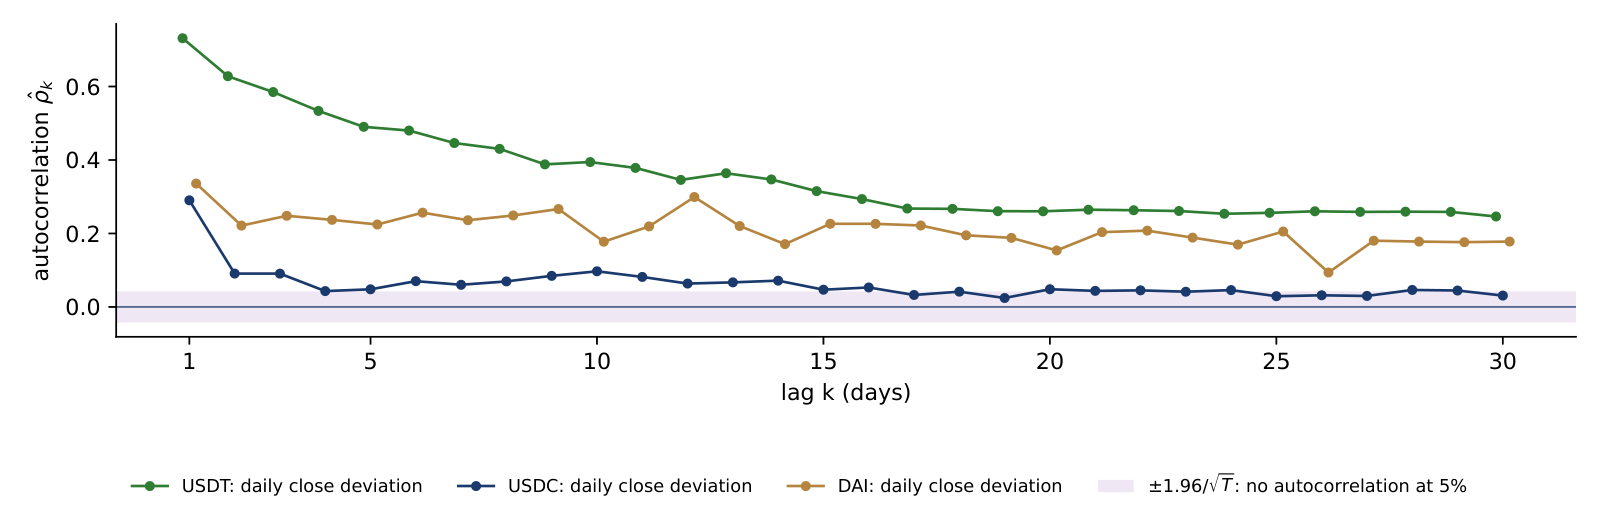
The table describes the daily deviations (5.1) of USDT, USDC and DAI from one dollar, on 2,122 daily closes from 2021 to October 2026, from aggregated EODHD prices; earlier years are excluded because the aggregate then included illiquid venues. The columns give, in bp, the mean, the standard deviation (sd), the 1% and 99% quantiles, the lowest close with its date, the percentage of days with \(|d| \geq 15\) and \(|d| \geq 50\), and the lowest intraday low. The last two columns give the excess kurtosis, which is 0 for the Normal distribution and grows with the weight of the tails, and \(\hat\rho_1\), the correlation of a day's deviation with the previous day's (lag-1 autocorrelation).
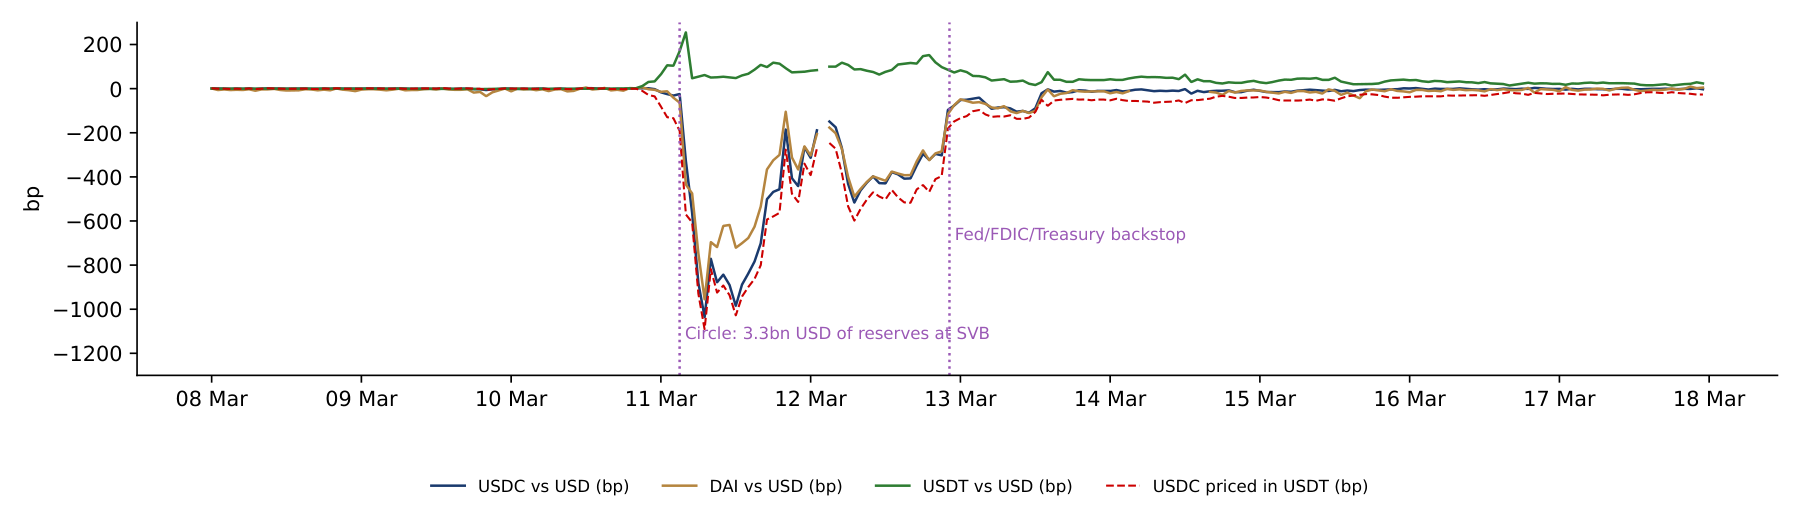
The means lie within ±0.5 bp for all three coins: the peg holds on average, and the risk is in the tails. USDC has an excess kurtosis of 1,045: its distribution is dominated by one weekend, SVB, with a lowest close of −285 bp on 11 March 2023. At the same time its 1% quantile, −7.6 bp, is the closest to zero of the three coins. A quantile and a kurtosis describe different parts of the distribution, and a coin can look safe on one and risky on the other.
USDT has the smallest extreme, a lowest close of −41 bp on 11 May 2022, during the collapse of TerraUSD, but the most persistent deviations: \(\hat\rho_1 = 0.73\), so a deviation today is largely still there tomorrow. It is beyond 15 bp on 3.6% of days. DAI is beyond 15 bp on 5.2% of days, the most of the three.
The lowest intraday prices are about 4 to 12 times deeper than the worst closes: −515 bp against −41 bp for USDT, −1,226 against −285 for USDC, −1,030 against −261 for DAI. Whether a liquidation used such a price depends on the price feed (oracle) of the lending protocol, which may read a close, an average or a single venue.


 Richard K. Lyons.

 BA_L5_weekday