

The slide of the lecture is on the left, the same figure on the right, computed in the browser from the same data. The ▶ button moves the parameter step by step.
Black–Scholes and the Greeks · Delta Hedging in Practice · Implied Volatility and the Smile · Bitcoin Options and the Volatility Surface · The VIX and the Variance Risk Premium · Options with Zero Days to Expiry · Case Studies: Option-Implied Bounds and Volatility Expectations
Black–Scholes and the Greeks
The Greeks: One Identity, All Sensitivities
Answer
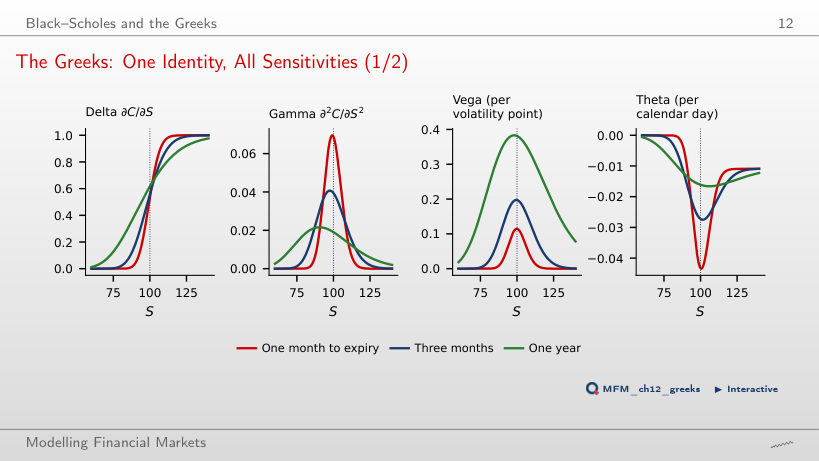
It falls from 0.078 to 0.016, almost like 1/σ, while vega stays almost constant (0.194 at σ = 10%, 0.197 at σ = 50%). At K = 100 and σ = 20%, the one-month call has the largest gamma (0.069, against 0.039 at three months and 0.019 at one year) and the fastest time decay (theta −0.043 a day), and the one-year call has the largest vega (0.381 per volatility point). Vega per unit change in σ is ΓS²στ. Per percentage point of volatility, vega is ΓS²στ/100: for the three-month call at S = K = 100 and σ = 20%, it equals 0.197.
Delta Hedging in Practice
Discrete Delta Hedging: Algorithm and Error
Answer
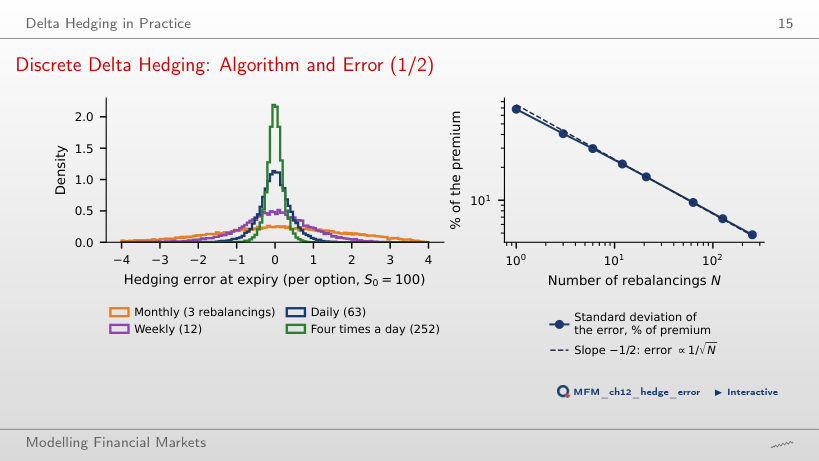
About four times as often. Doubling N approximately halves the error variance, not its standard deviation: the standard deviation falls like 1/√N (the estimated log-log slope is −0.48). Halving the standard deviation requires approximately four times as many rebalancings: from 63 to 252 over the three months. In the simulation, the standard deviation falls from 9.5% to 4.8% of the premium. Transaction costs, however, grow with N: like N with a fixed cost per rebalancing, roughly like √N with costs proportional to the traded value.
Selling Volatility at 20%: Three Outcomes
Answer
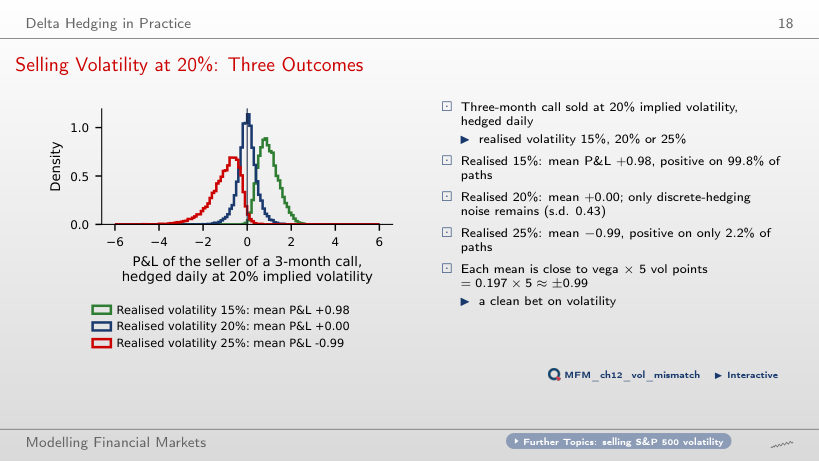
In this simulation, the seller gains on 2.2% of the paths. Mean P&L is −0.99 per option and its standard deviation is 0.68. The first-order approximation is vega × (implied volatility − realised volatility), or 0.197 × (20 − 25) ≈ −0.99. Daily rebalancing leaves a discrete hedging error, so some paths still produce positive P&L. With realised volatility of 15%, the mean is +0.98, positive on 99.8% of the paths.
Implied Volatility and the Smile
Three Sources of a Smile
Answer
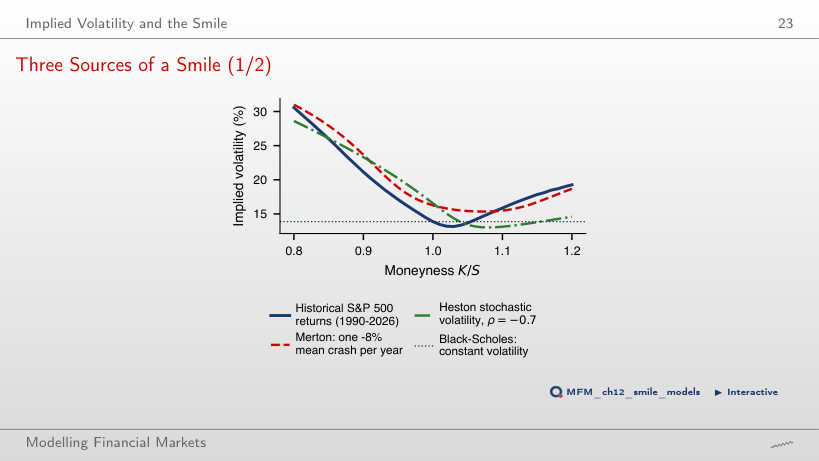
The tilt reverses: at ρ = +0.9, the Heston implied volatility is 10.7% at K/S = 0.8 and 28.2% at K/S = 1.2; at ρ = 0 the smile is nearly symmetric (23.7% and 22.4%). On the slide (ρ = −0.7), the highest implied volatility at K/S = 0.8 comes from the Merton jumps: 31.0%, against 16.3% ATM, close to the historical distribution (30.6%, against 13.9% ATM). Measured from the ATM level, the historical wing rises the most: 16.7 points, against 14.7 for Merton and 12.0 for Heston. Heston with ρ = −0.7 gives 28.6%, and its right wing is the lowest (14.6% at K/S = 1.2), because a negative correlation tilts the smile to the left.
Bitcoin Options and the Volatility Surface
The Bitcoin Smile
Answer
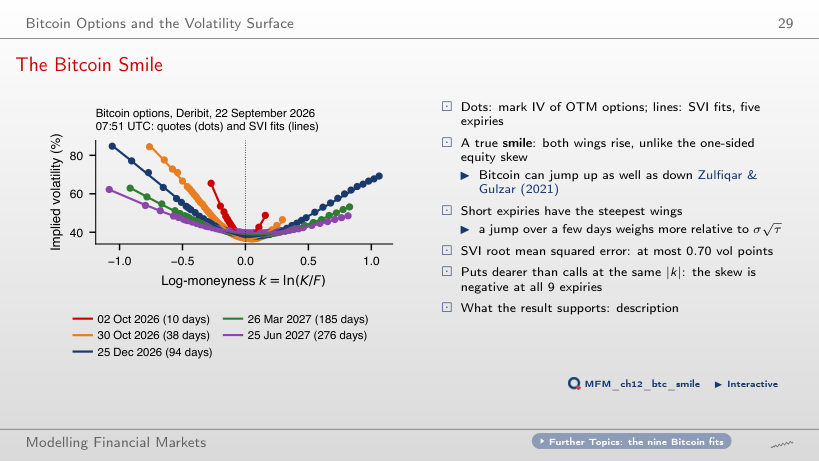
On the tested grid, the minima are negative for 2 October (−0.017) and 27 November (−0.009), although the errors of these fits are small (0.23 and 0.12 volatility points). A small fitting error does not guarantee absence of arbitrage. Passing this grid check is not a global guarantee either: for 9 October, g(−2.5) ≈ −0.242 outside the grid. In shape it is a smile, not a skew: both wings rise, because Bitcoin can jump up as well as down. Puts are still slightly dearer than calls at |k| = 0.15: the skew IV(k = +0.15) − IV(k = −0.15) is negative at all 9 expiries, from −0.1 points (10 days) to −2.4 points (66 days). The root mean squared error of the SVI fits is at most 0.70 volatility points.
What the Market Prices for Bitcoin
Answer
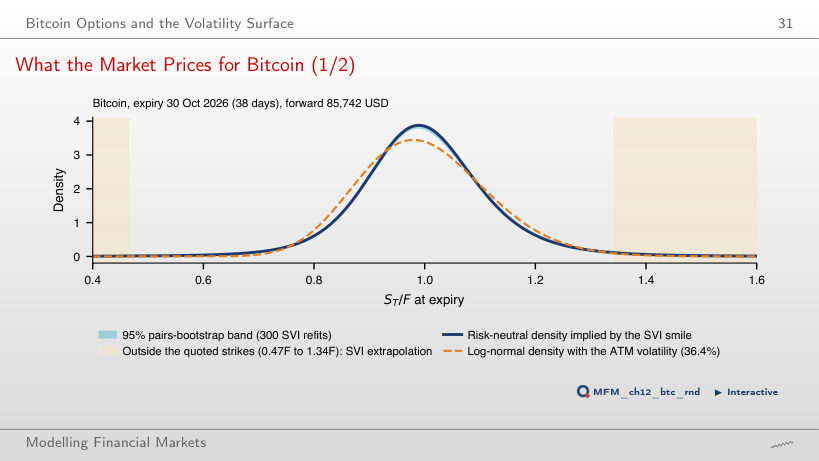
The estimated probability is 1.24%, with a 95% bootstrap interval of [1.16%, 1.27%], about 9 times the log-normal value. The 0.14% value comes from the log-normal benchmark with the ATM volatility of 36.4%. The 1.08% value omits the 0.16 percentage points extrapolated below the lowest quoted strike (0.47F). They are part of the estimated probability, but depend on the SVI extrapolation.
The VIX and the Variance Risk Premium
The VIX, 1990–2026
Answer
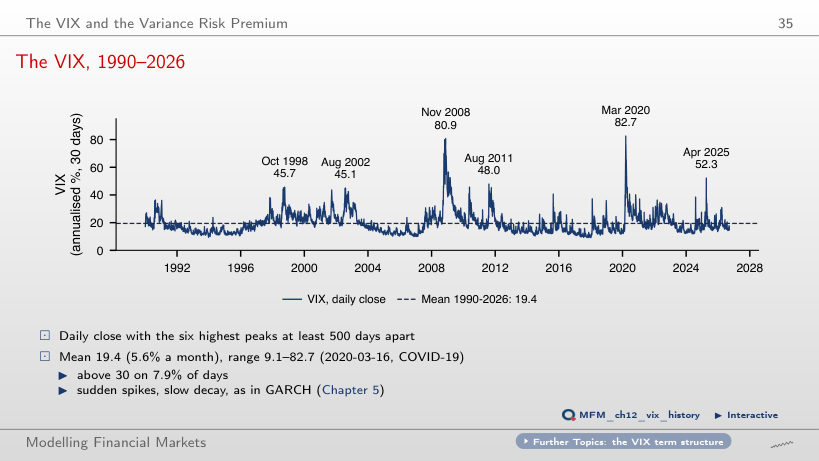
VIX exceeded 30 on 7.94% of the 9,284 days. The 0.81% figure corresponds to the threshold of 50, and 37.01% to the threshold of 20. Exceedance frequency depends on the chosen threshold. The mean is 19.4, and the maximum, 82.7, was reached on 16 March 2020. Spikes are sudden and decay slowly, as in GARCH models.
Implied vs Realised Volatility, S&P 500
Answer
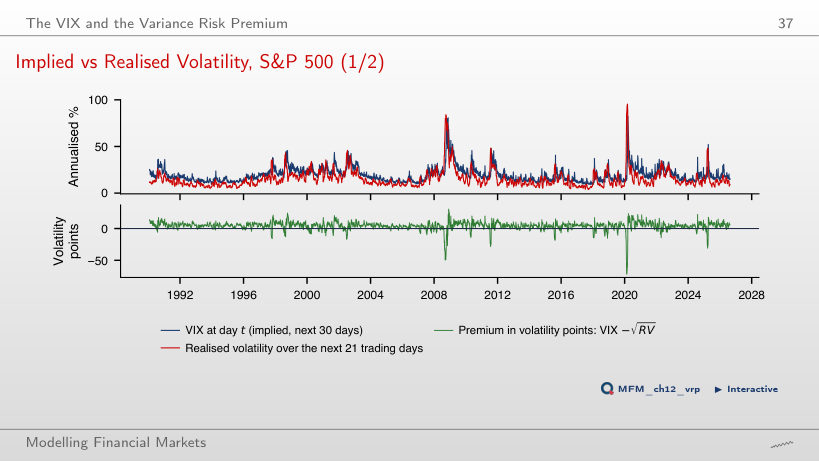
On approximately 86% of days; 14% corresponds to the opposite event. An unbiased forecast does not automatically imply a 50% exceedance frequency. Over the full sample, the mean premium is 4.09 volatility points (Newey–West standard error 0.27), or 113 %² in variance, with t = 5.5. Negative values occur when subsequent realised volatility exceeds VIX; the largest losses occur during stress episodes: the worst window, starting on 20 February 2020, has −72.0 points. From 2020, the mean volatility difference is 3.82 points, with Newey–West SE 0.90 and t = 4.25. The mean variance difference is 73.90 %², with SE 79.90 %² and t = 0.92.
Is the VIX a Good Forecast?
Answer
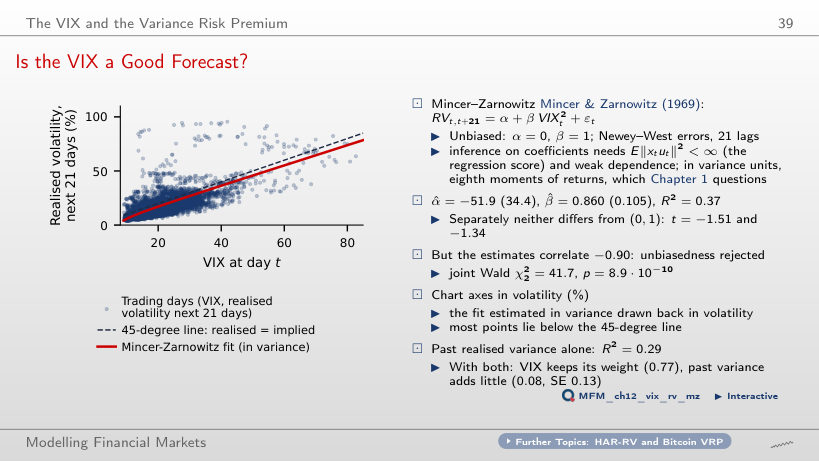
The separate tests do not determine the joint test’s result. Here, the estimates have correlation −0.90 and both deviations from the null are negative (α̂ = −51.9, β̂ − 1 = −0.14). Using this covariance, the Wald test gives χ²₂ = 41.7 and p ≈ 8.9·10⁻¹⁰. The VIX explains R² = 0.37 of the subsequent realised variance, past realised variance only 0.29.
Options with Zero Days to Expiry
Gamma and Time Decay Near Expiry
Answer
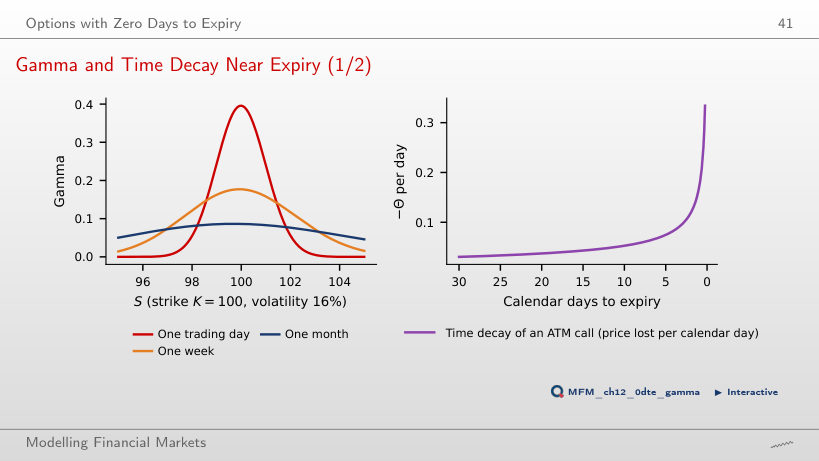
At S = K = 100, r = 0 and σ = 16%, gamma is 0.396 for τ = 1/252 and 0.086 for τ = 21/252. The ratio is approximately √21 ≈ 4.6: the φ(d₁) factor changes very little here. A 1% move in the last day changes delta by about 0.4; the relation dΔ ≈ Γ·dS is a local approximation. The values 0.167 and 0.030 are −theta per calendar day, evaluated with one and 30 calendar days remaining.
Case Studies: Option-Implied Bounds and Volatility Expectations
Case Study: the Bound and the Realised Premium
Answer
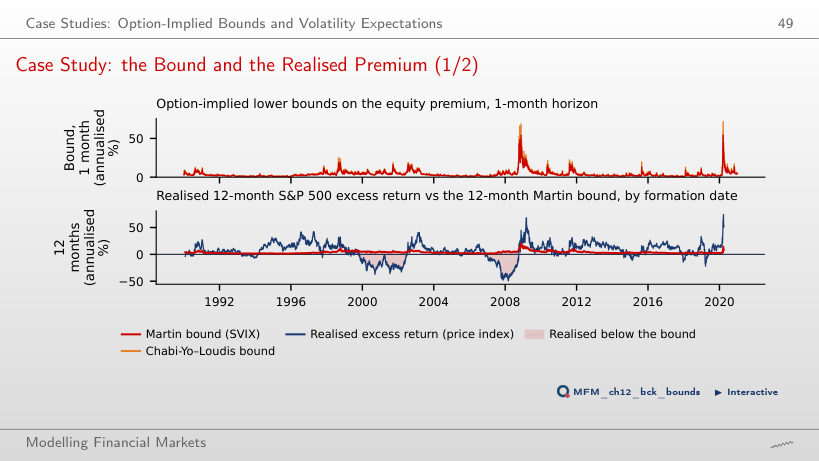
No. The bound restricts the conditional mean Eₜ[Rᵉ], not each realised return. D₁ = 0 at all horizons means that the test does not reject validity; it does not prove it. For tightness, the asymptotic tests reject, but the finite-sample p-value at 12 months is 8.3%, so that test does not reject at 5%. Mean slackness at 12 months is approximately 5.18 percentage points a year in the paper, including dividends, and 2.91 for the price index in the figure. The correlation between the bound and the realised return is only 0.15.
How the VIX Responds to a Shock to Expected Variance
Answer
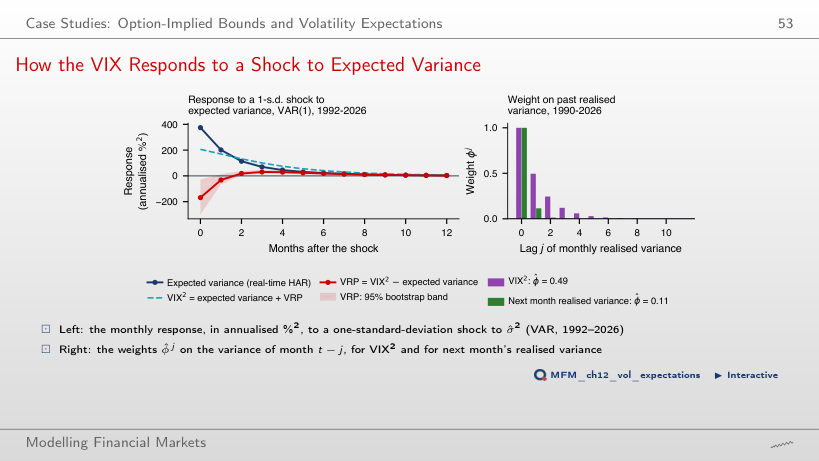
The point estimate is negative in every sample: −69 %² up to 2005, −254 %² up to 2008. The pointwise 95% band includes zero only for the sample ending in 2006. In the full sample, the response is −169 %², with a band of [−300, −27]: VIX² rises by only 55% of the shock to expected variance. The VRP response turns positive from month 2 and peaks in month 3 (+30 %²). The weights point the same way: φ̂ = 0.49 for VIX², against 0.11 for next month's realised variance. The result is conditional on the Cholesky ordering and the estimated HAR series; it does not by itself establish a trading rule or identify slow-moving expectations.
S&P 500 and VIX: EODHD daily closes, 1990–2026. Bitcoin options: snapshot of the Deribit chain, 22 September 2026, 07:51 UTC. Delta hedging: 20,000 paths of geometric Brownian motion. Case study: daily bounds from the replication package of Back, Crotty and Kazempour (2022); risk-free rate from the Kenneth French Data Library. Second case study: monthly S&P 500 and VIX, January 1990 – August 2026.