

The slide of the lecture is on the left, the same figure on the right, computed in the browser from the same data. The ▶ button moves the parameter step by step.
Motivation: Forecasting Conditional Volatility · Variance Dynamics · Estimation and Uncertainty · Forecasts and Results by Market · Asymmetry and Model Choice · Innovations and Diagnostics · Forecasting and Forecast Evaluation · Extensions and Limits · Case Studies: Quasi Score-Driven Volatility and Volatility Cycles
Motivation: Forecasting Conditional Volatility
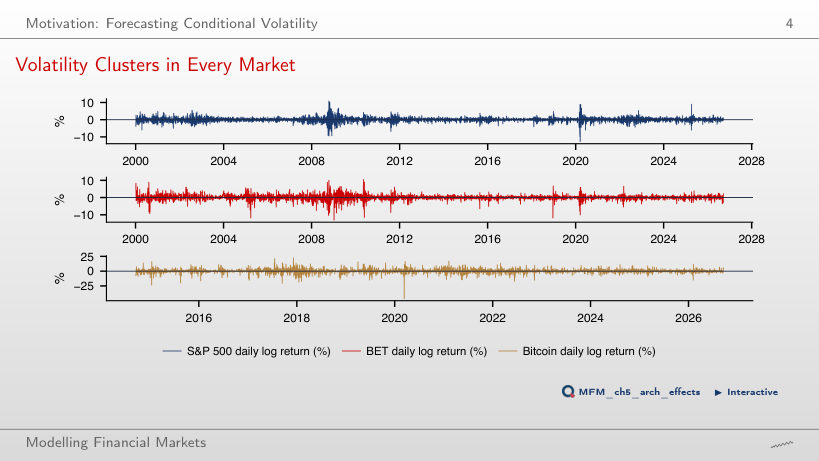
Volatility Clusters in Every Market
Answer
In 62% of the cases. The threshold is exceeded on 105 days (1.6% of the days); with independent days, the probability would be 8%. The share is 54% for BET and 32% for Bitcoin.
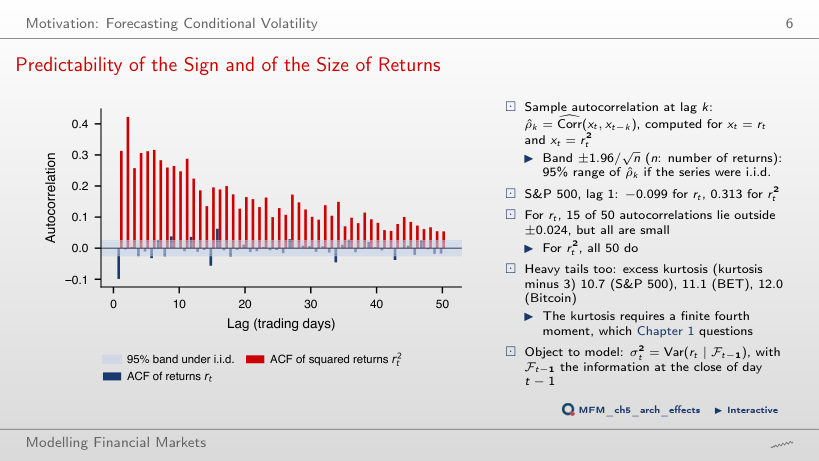
Predictability of the Sign and of the Size of Returns
Answer
Dependence in return magnitudes can exist without strong linear dependence in returns. All 50 autocorrelations of r² lie outside the ±0.024 band; for r, 15 of 50 do, but all are small. Small autocorrelations do not imply independence, and squared-return autocorrelations do not measure sign-forecast accuracy. The ±0.024 band is a pointwise asymptotic reference under the i.i.d. assumption.
Variance Dynamics
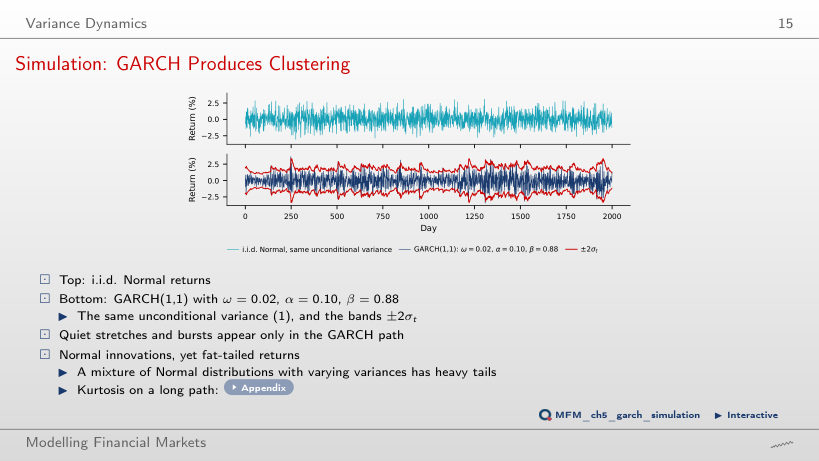
Simulation: GARCH Produces Clustering
Answer
Yes, the unconditional return distribution has theoretical excess kurtosis of approximately 3.06. The fourth moment is finite because 0.98² + 2 × 0.10² = 0.9804 < 1. The conditional distribution is Normal; the unconditional distribution mixes different variances. Estimated excess kurtosis is 0.40 on the page's 2,000-day path and 2.47 on the lecture's million-day path: kurtosis is estimated imprecisely on short samples.
Estimation and Uncertainty
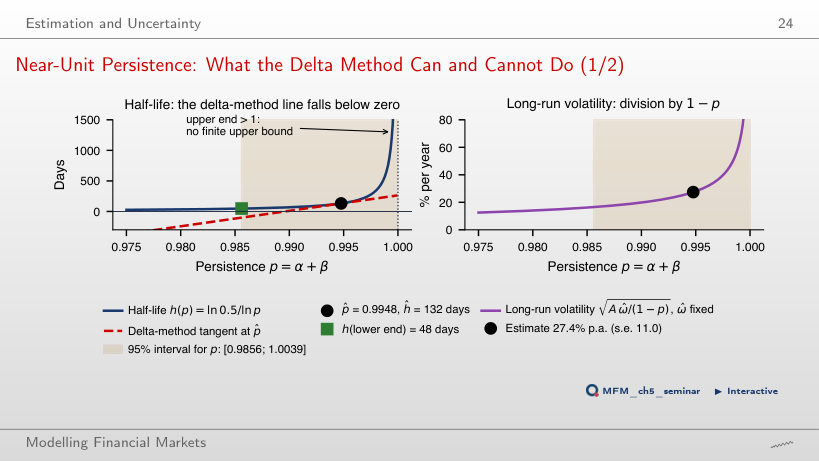
Near-Unit Persistence: What the Delta Method Can and Cannot Do
Answer
No. Removing negative values does not justify coverage. The problem is the curvature of h(p) near 1: the delta-method tangent falls below zero. Transforming the p < 1 portion of the persistence interval, [0.9856, 1.0039], gives a lower endpoint of about 48 days and no finite upper endpoint; values p ≥ 1 do not describe a shock that halves.
Forecasts and Results by Market
Volatility Term Structure
Answer
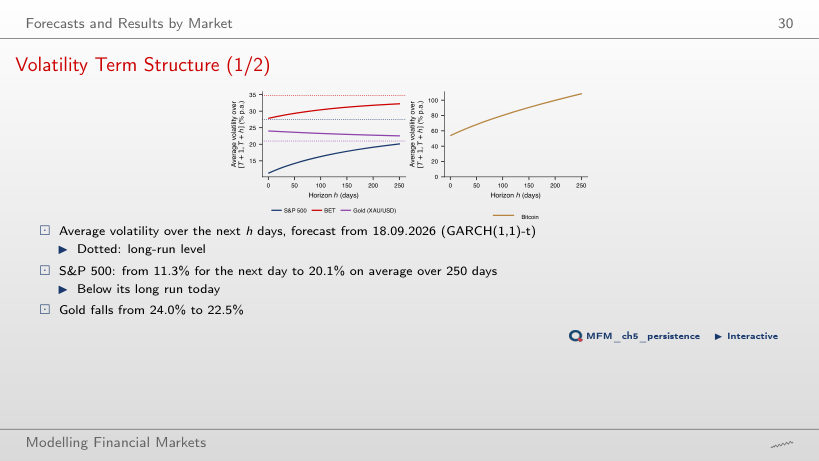
The page computes √(A · H−1 Σj=1H Et[σ2t+j]), where A is the number of returns per year. Averaging precedes taking the square root. At H = 250 the result is 20.1%; it is neither average volatility nor the final day's volatility. The forecast rises towards the long-run level of 27.4%, because the current level is below it. For gold the curve falls from 24.0% to 22.5%; for Bitcoin α̂ + β̂ = 1 and the 250-day value is 108.3%.
Persistence: How Fast Do Shocks Fade?
Answer
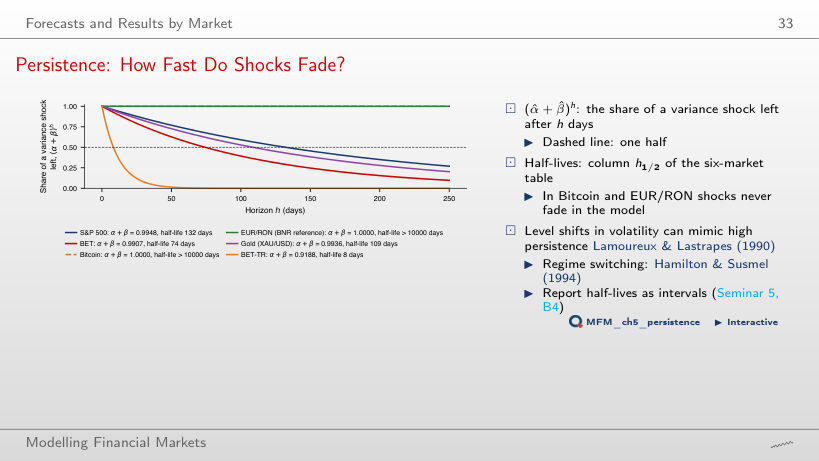
It stays unchanged. The remaining effect is proportional to the initial shock, but the remaining fraction is ph. Half-life depends on p, not amplitude: about 132 days for the S&P 500 and 8.18 days for BET-TR. After 100 days, 59% of the shock is left for the S&P 500 and practically nothing for BET-TR. For Bitcoin and EUR/RON α̂ + β̂ = 1, so in the model the shocks never fade.
S&P 500: GARCH Volatility and the VIX
Answer
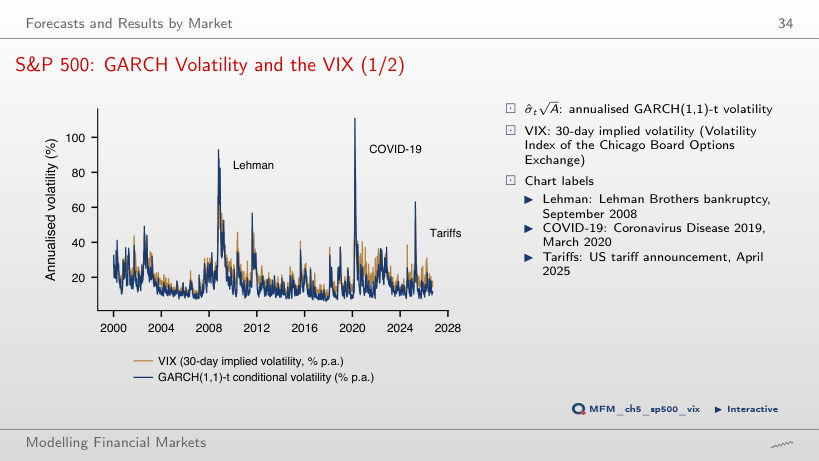
No. The variance risk premium compares VIX² with a 30-day variance forecast under the physical probability, while σ̂ is a one-day volatility, filtered with the parameters estimated on the full sample. The VIX exceeds the GARCH volatility on 84% of the days.
Asymmetry and Model Choice
The News Impact Curve for the S&P 500
Answer
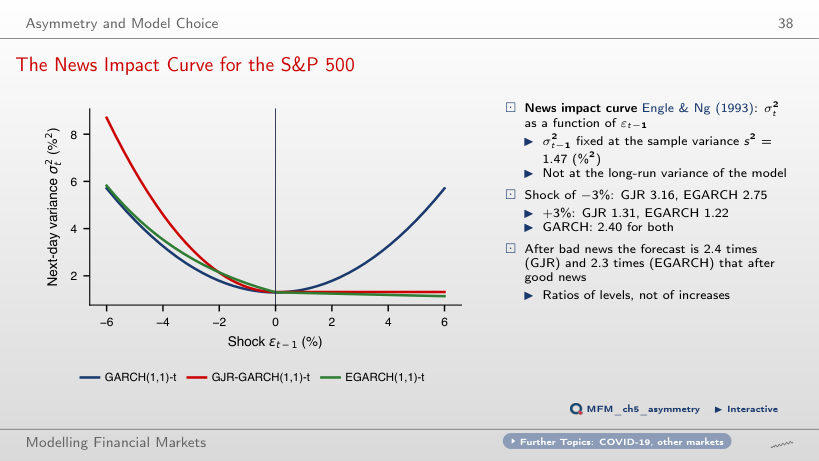
It remains approximately 1.85 %². The difference is γ × 3² ≈ 1.846 %². The previous-variance term increases equally for both signs and cancels from the difference. Doubling previous variance does not double the asymmetry; the percentage shocks remain fixed. At σ²(t−1) = 1.47, EGARCH gives 2.75 and 1.22, and GARCH(1,1) gives 2.40 for both shocks.
Innovations and Diagnostics
S&P 500: Are the Innovations Normal?
Answer
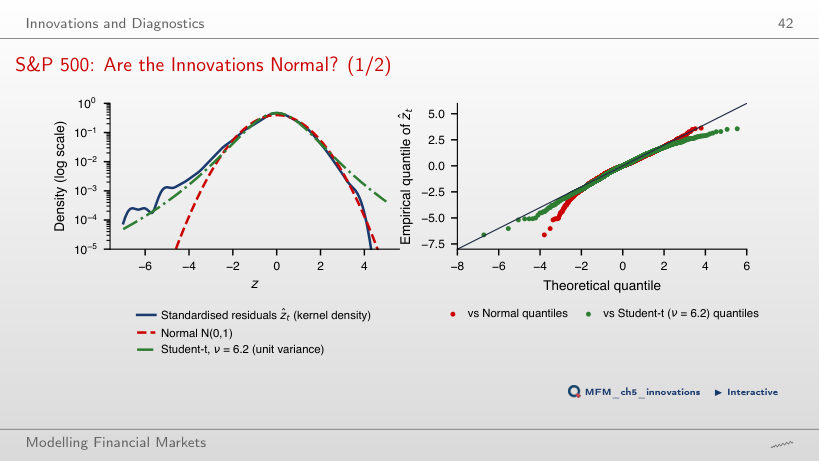
The slider changes the reference distribution, not the estimated residuals. The 16 observations remain unchanged. The expected count under the Student-t falls from about 8.6 to about 0.9 at ν = 30; 0.21 are expected under the Normal distribution. The excess kurtosis falls from 10.7 (returns) to 1.73 (residuals), but normality is clearly rejected: Jarque–Bera 1,156.
Forecasting and Forecast Evaluation
Out-of-Sample Design and Forecast Paths, 2016–2026
Answer
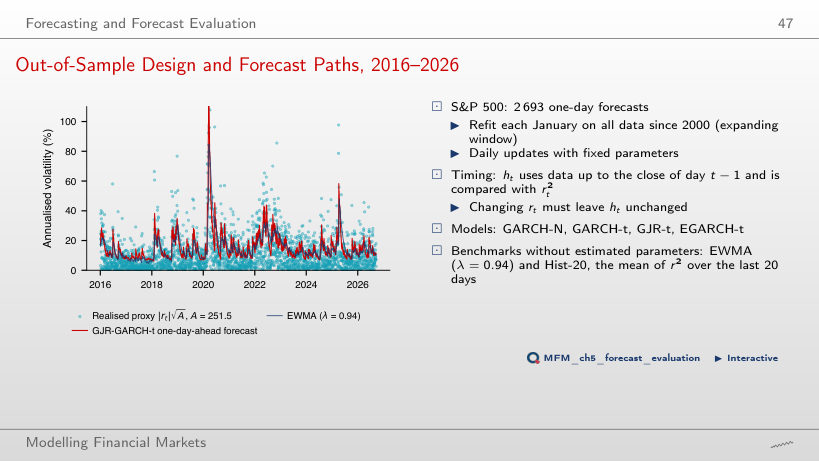
No. Forecasts for a fixed λ use past data, but retrospective selection of λ uses outcomes from the entire period. The grid minimum is about 0.812, versus 0.814 at λ = 0.94 and 0.731 for GJR-t. Evaluating the selection procedure requires a separate period or rolling selection. Against GARCH-t, the DM t of EWMA with λ = 0.94 is 3.47.
S&P 500: Does Anything Beat GARCH(1,1)?
Answer
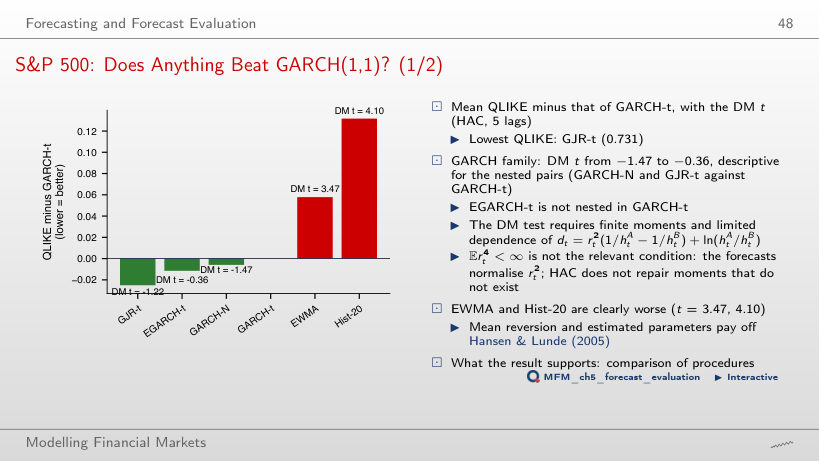
GARCH-t is nested in GJR-t, and the estimated-model forecasting scheme does not automatically justify a standard Normal reference for DM. The negative difference describes the observed average advantage. It establishes neither statistical superiority nor equal accuracy. EWMA (t = 3.47) and Hist-20 (t = 4.10) have larger losses; with MSE the ranking changes: EGARCH-t has the lowest value, 21.30.
Extensions and Limits
Long Memory: the Shape of the ACF of |r|
Answer
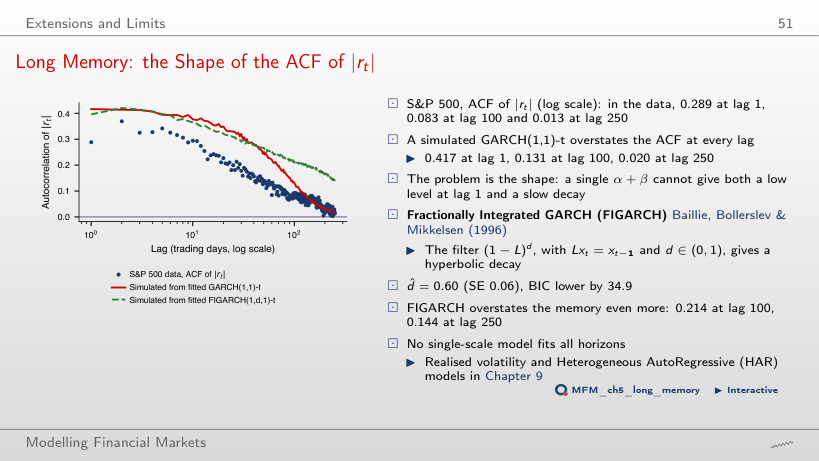
No. High persistence is not the same as long memory. For this curve, the autocorrelations sum to ρ₁/(1 − p), which is finite. Separately, the empirical fit is imperfect: with ρ₁ = 0.289, least squares over 250 lags gives p ≈ 0.9875, rather than the initial value of 0.9948; the curve falls too fast at first (0.258 against 0.295 at lag 10) and too slowly afterwards (0.156 against 0.132 at lag 50). The data have 0.289 at lag 1, 0.083 at lag 100 and 0.013 at lag 250.
Case Studies: Quasi Score-Driven Volatility and Volatility Cycles
Case Study: Replication on 11 Stocks (cf. Paper, Fig. 2)
Answer
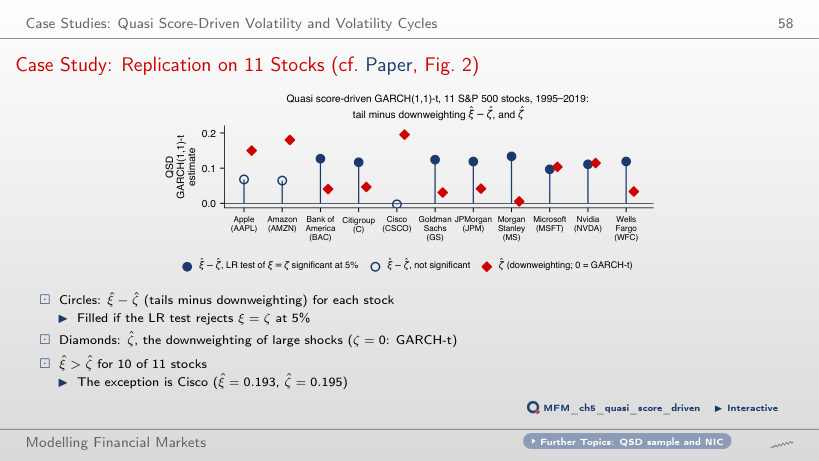
It decreases. The contribution, in units of αft, decreases from approximately 6.46 to 4.11. For this large shock, increasing ζ strengthens downweighting. The density parameter ξ remains separate from ζ in QSD. Across the 11 stocks, ξ̂ > ζ̂ for 10 (the exception is Cisco); the LR test rejects ξ = ζ at 5% for 8 stocks and ζ = 0 (the GARCH-t update) for 9.
S&P 500: The Slow Volatility Component and Forecasts Months Ahead
Answer
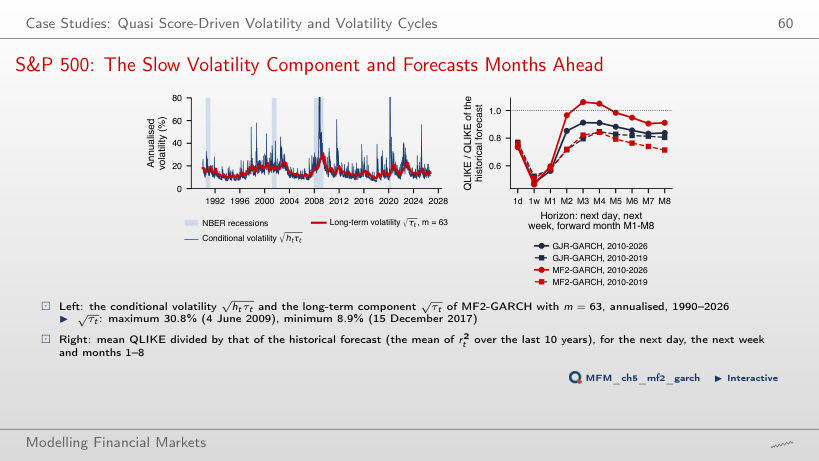
No. Under the lecture's asymptotic approximation, the one-sided threshold is 1.645. The statistic of 0.99 does not exceed it. GJR has lower average loss in this sample, without evidence of superiority at 5%; this does not establish equality. Over 2010–2019 the ranking was reversed: 0.714 for MF2-GARCH and 0.806 for GJR-GARCH (DM t −2.66).
Daily log returns in %, closes up to 18 September 2026: S&P 500, BET, BET-TR, Bitcoin, gold (XAU/USD) and the VIX, EODHD prices; EUR/RON: the BNR reference rate. Case studies: 11 S&P 500 stocks, 1995–2019, and the S&P 500, 1990–2026, EODHD prices.